Research Paper
Analysis of the Proposed 2020 FHFA Rule on Enterprise Capital
December 21, 2020
This analysis by Edward Golding, Laurie Goodman, and Jun Zhu evaluates the Federal Housing Finance Agency’s (FHFA) 2020 proposed rule on capital requirements for Government-Sponsored Enterprises (GSEs), Fannie Mae and Freddie Mac. The authors assess the proposed capital framework, which includes Basel-like requirements, leverage ratios, and additional buffers. They critique the complexity and potential consequences of applying a banking capital regime to GSEs, which are fundamentally different in structure and risk profile.
The FHFA’s 2020 proposed capital rule for GSEs introduces a complex framework that may not be well-suited to the unique nature of Fannie Mae and Freddie Mac. The analysis highlights several critical points:
• Basel Framework Misapplication: The rule relies heavily on a banking model, which is overly complex and not entirely appropriate for the GSEs' monoline business focused on mortgage credit risk, not the broader banking risks.
• Excessive Leverage Requirements: The high leverage ratio requirements could become the binding constraint, discouraging risk mitigation strategies like credit risk transfers (CRT) and potentially leading to higher mortgage rates.
• Procyclicality and Market Stability: The stability buffer and other capital buffers create high marginal capital requirements that could exacerbate procyclicality, limiting the GSEs' ability to act countercyclically during market stress.
• Inadequate CRT Credit: The proposed rule does not provide sufficient capital relief for CRT transactions, which are effective in offloading credit risk and enhancing market stability.
• Capital Allocation Issues: The capital requirements disproportionately penalize low-risk loans and high-LTV purchase loans, potentially driving high-quality loans away from the GSEs and affecting their ability to support affordable housing.
The authors recommend a simpler, more tailored capital framework that better aligns with the GSEs' risk profiles and public mission. They suggest reducing the leverage ratio, revising the stability buffer, and providing adequate credit for CRT transactions to ensure the GSEs can continue to support a stable and affordable housing market.
This paper analyzes the Federal Housing Finance Agency’s (FHFA’s) 2020 notice of proposed rulemaking (2020 NPR) for the government-sponsored enterprises’ (GSEs’) capital standards (FHFA 2020a). This represents an update to the 2018 NPR; our paper on that proposal suggested how to better align capital and risk and pointed out the procyclicality of the proposal (Golding, Goodman, and Zhu 2018). The 2020 NPR made several improvements to the 2018 proposed capital standards but added new components. In particular, the 2020 NPR added several minimum thresholds and standards, incorporated various cushions, and added a countercyclical adjustment. After analyzing the 2020 NPR, we find the following:
This paper is organized as follows: section 2 looks at the overall proposal, including the Basel-like structure of these capital requirements, section 3 looks at the credit risk component, section 4 looks at the countercyclical adjustment, and section 5 presents our recommendations and conclusions.
The complicated structure of these capital requirements stems from an overreliance on the Basel framework that is used to judge capital adequacy for the banking system. The Basel framework contains a set of riskbased capital requirements and a set of leverage ratios. In addition, the proposed rule would require the GSEs to comply with the risk-based capital requirement using the higher of its risk-weighted assets (RWAs) calculated under the standardized approach (described in the proposal) and the advanced approach (using its internal model).
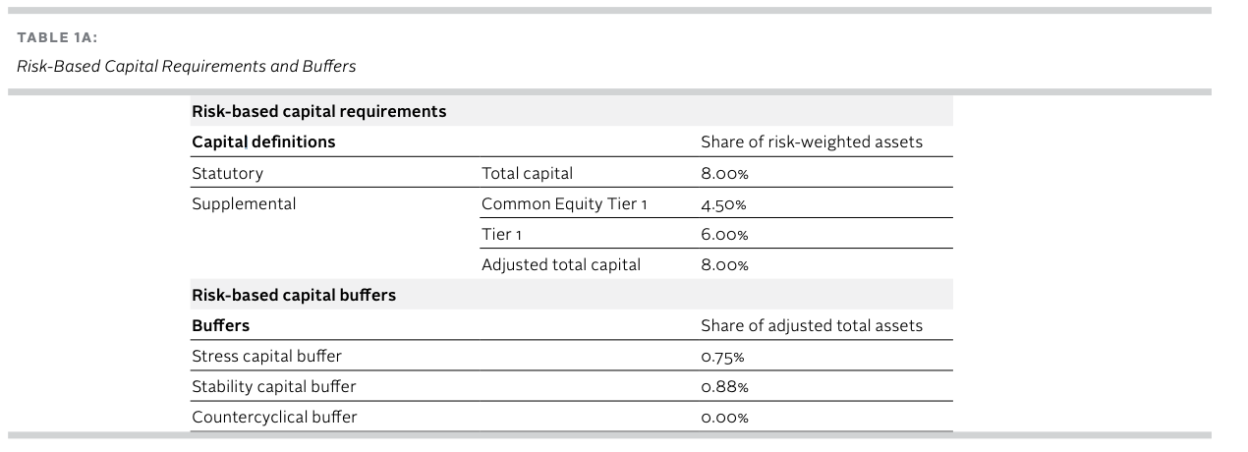
Table 1A: Risk-Based Capital Requirements and Buffers
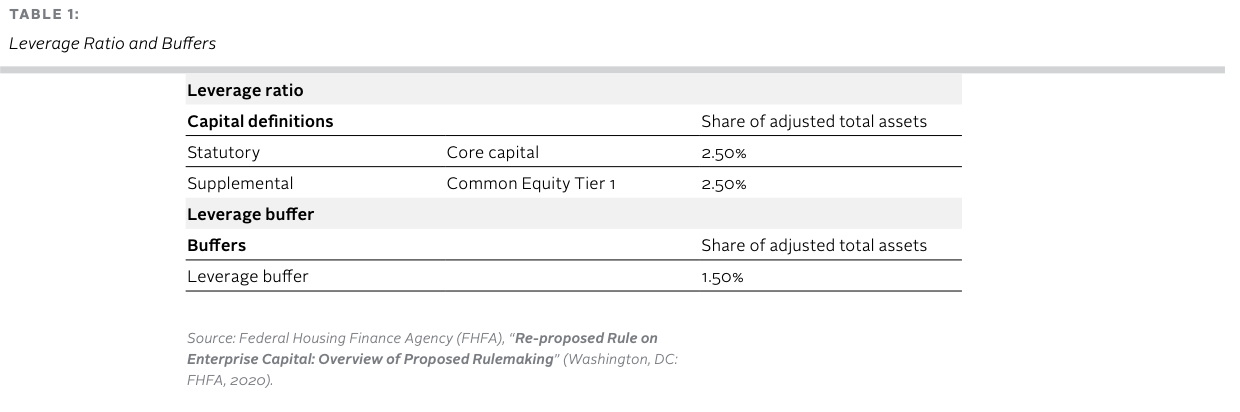
Table 1: Leverage Ratio and Buffers
For the risk-based requirements, the first step is to calculate the RWAs, as every asset has a risk weight. The total risk-based capital requirements are 8 percent of the RWAs (table 1A). There are supplemental capital requirements to ensure enough capital is considered as equity. For example, there is a requirement that Tier 1 capital (i.e., equity capital, retained earnings, and noncumulative, nonredeemable preferred stock) is at least 6 percent of the RWAs. The Common Equity Tier 1 capital must be more than 4.5 percent of the RWAs. The difference between the 6 percent Tier 1 capital requirement and the 8 percent total assets requirement is that total assets includes both Tier 1 and Tier 2 capital, where the Tier 2 capital includes less expensive capital sources, such as revaluation reserves, hybrid capital instruments, subordinated term debt, general loan-loss reserves, and undisclosed reserves. These are generally well in excess of 2 percent, making the Tier 1 capital the binding constraint.
In addition to the risk-based capital requirements, there are risk-based capital buffers, known as the prescribed capital conservation buffer amount (PCCBA). As shown in table 1A, the risk-based capital buffers include a stress capital buffer of 75 basis points (bps), a stability capital buffer based on market shares that averages out to 88 basis points for the GSEs (105 basis points for Fannie Mae and 64 basis points for Freddie Mac), and a countercyclical buffer that is initially set to 0 percent and is intended to address excess growth. Thus, the risk-based buffers total 180 basis points for Fannie Mae and 139 basis points for Freddie Mac. These buffers are applied to adjusted total assets instead of RWAs. If the institutions fail to hold enough capital to cover the buffers, there are strict limits on capital distributions and discretionary bonus payments.
Table 1B shows the leverage ratios. The leverage ratio is 2.5 percent for both core capital and Common Equity Tier 1 capital. In addition, there is a prescribed leverage buffer amount (PLBA) of 1.5 percent, for a total leverage plus PLBA requirement of 4.0 percent. Again, if the institutions meet the leverage requirement but cannot cover the buffers, there are strict limits on capital distributions and discretionary bonus payments.
Given that the enterprises would face both risk-weighted capital requirements and leverage requirements, it is useful to look at which one would be more binding. For the risk-weighted capital requirements, we cannot compare those prescribed in this NPR with the GSEs’ own results, as we do not have the latter.
To calculate the risk weights over time, we looked at data from the Fannie Mae single-family loan performance dataset, which includes information on fixed-rate, full-documentation, amortizing loans that were not purchased under an affordable housing program. We further narrowed our data to 30-year loans (terms of 241 to 360 months). We calculated the capital that would be required for each book of business, based on the composition of outstanding loans. We included the effects of mortgage insurance but did not give any credit to CRT. Our calculated capital and losses do not include the effects from low-risk 15- and 20-year mortgages, high-risk adjustable-rate mortgages, and high-risk fixed-rate mortgages because those loans are not covered by the Fannie Mae single-family loan performance database (interest-only loans, 40-year loans, loans purchased under special affordability programs, which would be higher risk). We also exclude the multifamily book of business, which has a higher risk weight than the single-family book of business. Unless noted, all the capital and losses in this paper are based on this sample. We also do not include nonmortgage assets that are often held for liquidity and cash management purposes that tend to be low risk.
Overall, our results are close to the FHFA results for Fannie Mae’s single-family business for the 2019 book of business. We calculate a total risk-based charge of 208 basis points; the FHFA shows a capital charge of 226 basis points before CRT and 197 basis points after. We use our numbers and then added 32 basis points for market and operational risk to total capital (as per FHFA 2020b); for our Tier 1 capital calculations, where the required risk-weighted assets are required to be 6 percent (versus 8 percent for total capital), we added 24 basis points (32 x 6/8).
Figure 1 shows the results of our analysis for Fannie Mae with and without the buffers. (We assume Fannie Mae’s market share is roughly constant, and hence the buffers are constant.) If we assume that the Tier 1 capital charge is more binding than the total capital charge, the Tier 1 risk-based capital charge would be binding until 2012 or 2013. After that period, the leverage ratio is the binding constraint. If we assume the total capital charge is more binding than the Tier 1 capital charge, the risk-based capital charge would be binding until 2016, after which the leverage ratio is the binding constraint. Looking at the analysis with or without the buffers does not materially change this conclusion. Also, Tier 1 capital includes certain preferred stock while the leverage ratio is based on common equity only. This reinforces the point that the leverage ratio is frequently more binding.
If current underwriting patterns continue, the absolute leverage requirement will continue to be the binding constraint. The absolute leverage requirement is well above the amount of Tier 1 capital required. This suspends any incentive to reduce risk through credit risk transfer or other means. In general, we would expect the GSEs would accumulate more risk to earn a better return on the increased equity. We recommend that the absolute leverage requirement be reduced from 2.5 percent to no higher than 2 percent, and that the leverage buffer be reduced from 1.5 percent to no higher than 1 percent. We do recognize the buffer plays an important role, providing an additional layer of capital that can be drawn on when losses are incurred, and providing additional protection when the losses are incurred quickly. However, the current level of the leverage buffer seems excessive, and will contribute to the absolute leverage requirement being the binding constraint.
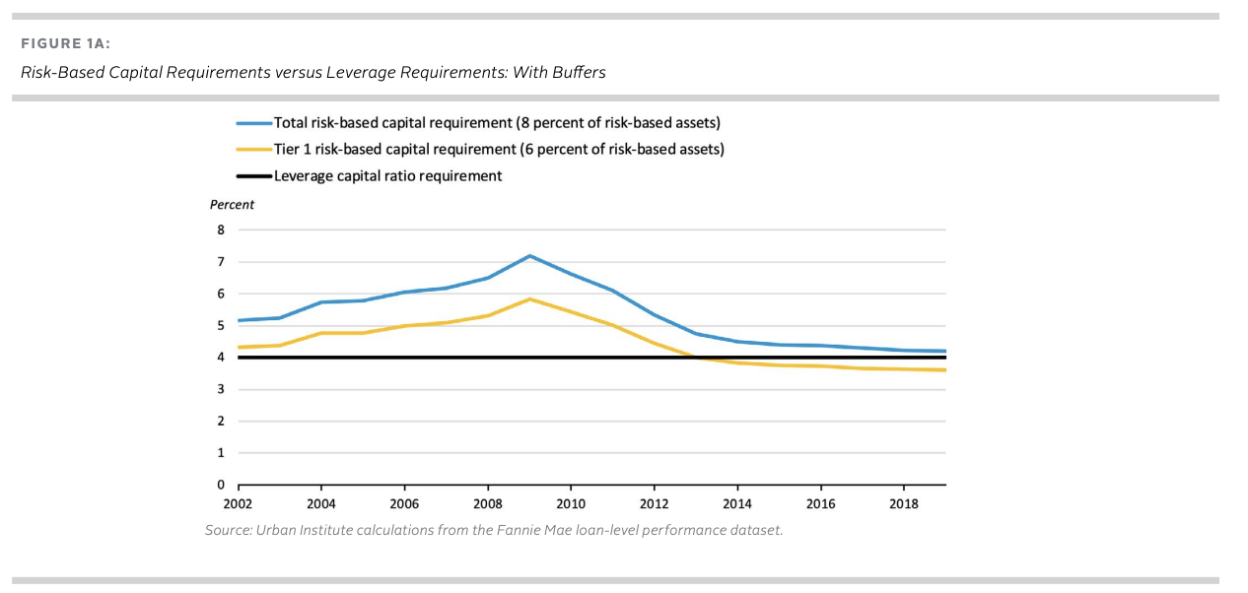
Figure 1a: Risk-Based Capital Requirements versus Leverage Requirements: With Buffers
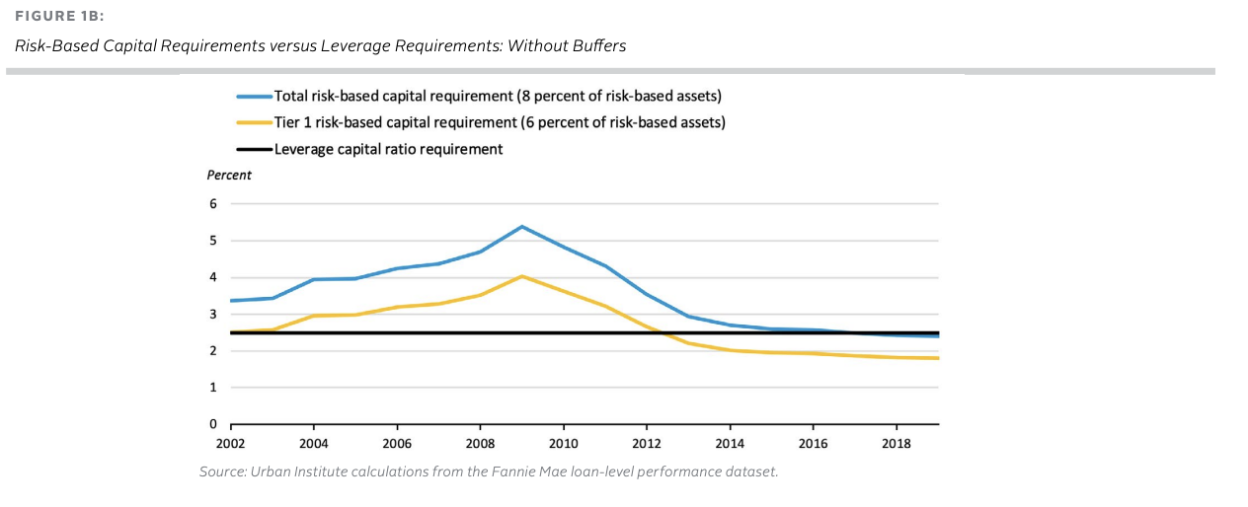
Figure 1b: Risk-Based Capital Requirements versus Leverage Requirements: Without Buffers
The proposed capital requirement framework is much like the banking system’s Basel framework and was designed to mimic that framework. But there is a mismatch between the structure of the rule and the structure of the GSEs’ risk profile, which will affect how the GSEs manage their risk. This complex set of capital requirements may be necessary for banks, who engage in a wider range of activities, take more types of risk, and are more structurally complicated. In contrast, the GSEs are essentially monoline businesses, and one could apply a simpler framework. In addition, Basel evolved based on compromises among international regulators. Some of the weaknesses we will point out in this research stem from applying the Basel framework to the GSEs.
To drive home this point, consider the mortgage market. Mortgage lending is one activity for banks. When they hold loans in portfolio, they take both the credit risk and the interest rate risk. In contrast, the GSEs take only the credit risk, and the secondary mortgage market takes the interest rate risk. And the credit risk is typically only a fraction of the interest rate risk.
For example, in October 1981, the mortgage rate went to 18.45 percent,1 and the loss on mortgages was at least 40 cents on the dollar.2
The result was the mark-to-market insolvency of the entire savings and loan industry and Fannie Mae. In contrast, the credit risk losses on the GSE-underwritten mortgages peaked at around 4.3 percent for the 2008 book of business, the worst book of business. And this was more than double the losses in benign years. Even putting in a market risk premium, the credit loss is only a fraction of the interest rate risk losses.
We can also look at the limited price experience of the CRT market to understand the volatility of credit losses. In March 2020, when the pandemic hit, CRT prices on the mezzanine tranches plummeted, and it was the largest drop in prices in the market’s short history. The price change from January 2, 2020, to the low point on March 23, 2020, was 35 percent on Vista’s 2019 CRT Indices, which consisted of the mezzanine and equity pieces. The price change was similar for the indexes for other years. Even if we use this number for the most subordinated 4 percent of the deal, including the more senior tranches, this would suggest credit market risk on the collateral of $1.40, compared with the $40 interest rate loss described above.
The GSEs are monolines in a safe asset and largely distribute the interest rate risk into the market through mortgage-backed securities (MBS), but because they are monolines, they do not benefit from diversification across business lines. The FHFA proposal takes this lack of diversification into account by calibrating the capital to the 2008 financial crisis, which was predominantly caused by a housing bubble. Second, diversification is less helpful on the downside, as correlations tend toward one when capital markets collapse.3 Moreover, monolines should be easier to oversee and regulate. Given the GSEs’ monoline book of business and the fact that the FHFA proposal accounts for the 2008 housing crisis, we believe it is unnecessary to saddle the system with a Basel-like framework that does not fit the GSEs’ mission.
As a result, we question the need for a leverage standard other than one that is rarely binding. We suggest the FHFA concentrate on tailoring the risk-based capital requirements to the risks and mission of the GSEs and not focus so heavily on adopting the Basel standards to these institutions.
The FHFA analysis shows that for the Fannie Mae book of business as of September 30, 2019, the post-CRT net credit risk capital is 1.97 percent. The 1.97 percent credit risk component itself includes 15 percent minimum on risk weights or 1.2 percent capital on all single-family loans, regardless of riskiness. It also includes a 10 percent minimum risk weight or 0.80 percent capital charge on loans in which the credit risk has been laid off through CRT. Thus, without these minimums, the actual credit risk would be even lower. For 2019, we estimate the 15 percent loan-level minimum adds 44 basis points, a point we discuss in the next section.
To this is added a 0.18 percent market risk adjustment (to cover the spread risk on Fannie Mae’s balance sheet) and a 0.14 percent operational risk adjustment (to cover the risk of loss resulting from inadequate or failed internal processes, people, and systems or from external events, including legal risk) to bring the total capital requirement to 2.29 percent of total adjusted assets.
In addition, there is a 1.80 percent PCCBA, for a total capital requirement and PCCBA of 4.09 percent. As we mentioned earlier, the GSEs’ risk-based capital must be sufficient to cover the PCCBA to avoid limits on capital distribution and discretionary bonus payments. In short, the net credit risk component is less than half the total capital requirement plus PCCBA (1.97 / 4.09 = 48.2 percent). And if we consider the effects of the 15 percent loan-level minimum, a sensitive component, the ratio falls to 1.53 / 4.09, or 37 percent.
The net result of this analysis is that mortgage finance is more expensive than it needs to be. The actual credit risk component is less than half the risk-based capital requirement, and if the 15 percent single-family loan minimum is eliminated, the credit risk component is less than 40 percent.
1 See Freddie Mac PMMS rate: http://www.freddiemac.com/pmms/pmms30.html
2 See New York Times business section on October 22, 1981; the price of a GNMA 8% coupon was $57.
3 See for example, Stiroh and Rumble (2006) and Allen et al. (2016).
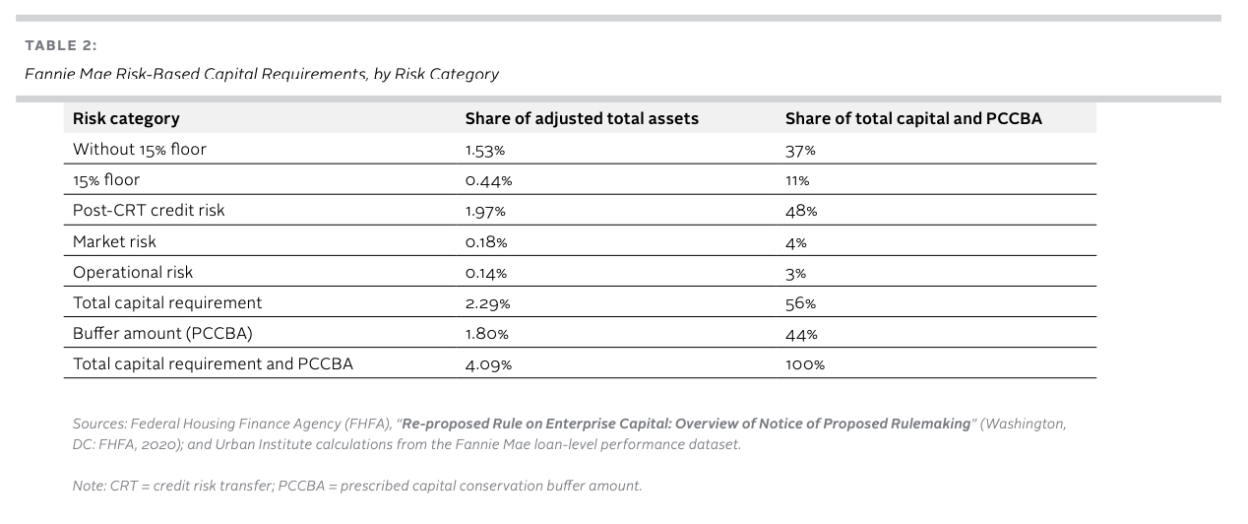
Table 2: Fannie Mae Risk-Based Capital Requirements, by Risk Category
The stability buffer, a part of the overall buffer discussed above, is based on the market share of Fannie Mae and Freddie Mac as a share of market debt outstanding. This buffer creates high marginal capital requirements and hence creates procyclicality in the capital requirements.
For the stability buffer, the first 5 percent of market share is free of capital charge. The institution faces a 5 basis-point charge for each percent above that. Fannie Mae has a 26 percent share, leading to a 105 basispoint capital requirement. Freddie Mac has an 18 percent market share, leading to a 64 basis-point capital requirement. We can summarize the stability buffer as a function of unpaid principal balance (UPB) and market debt outstanding (MDO) in equation 1.
Stability buffer = 100 * (UPB / MDO – 5%) * 5 bps * UPB (1)
We can calculate the marginal capital with respect to UPB, holding MDO constant, using equation 2:
Marginal capital with respect to UPB = 1,000 bps * (UPB / MDO) – 25 bps (2)
From equation 2, if we assume 18 percent market share for Freddie Mac, its marginal capital is 155 basis points, for any small change in UPB. That is, if the UPB for Freddie Mac increased from $2,237,500 to $2,237,501, the marginal capital requirement on that last dollar of UPB is 155 basis points. Similarly, if the UPB for Fannie Mae increased from $3,287,900 to $3,287,901, that last dollar of UPB has a marginal capital requirement of 235 basis points.
We do not understand why market share should factor into the capital buffers, and this calculation is especially distortionary. For example, during the first six months of 2020, the GSEs—because of COVID-19-related liquidity concerns that led to a pullback in the non-agency market—added $214 billion in net issuance (Goodman et al. 2020). On an annualized basis, this is the largest addition since 2007. In the wake of the Great Recession, the private markets also pulled back, in part because of liquidity concerns.
We suggest that the stability buffer, if it is necessary, be a fixed percentage (up to 50 basis points) and not related to market share. And if the stability buffer is a fixed percentage, it should be combined with the stress capital buffer that is also a fixed percentage. A combined buffer of 1 percent would provide over a $50 billion cushion for the two GSEs which is greater than their DEFAST losses of $43 billion over 9 quarters.4 Therefore a 1 percent buffer would provide FHFA plenty of time (over 9 quarters) to use prompt corrective action to reduce dividends and bonuses as losses eroded the buffer. . If the stability buffer were set at a maximum of 50 bps, with the 75 bps stress capital buffer it would provide a maximum buffer of 1.25 percent; well above this 1 percent level.
4 See https://capmrkt.fanniemae.com/resources/file/aboutus/media/2019-dodd-fr… and http://www.freddiemac.com/ investors/pdf/dodd_frank_stress_test_results2019.pdf
We will show that the FHFA’s credit risk capital overall adequately captures market losses in the worst year. But there are some severe distortions, with purchase loans being allocated more capital than they should be and cash-out refinances allocated less capital.
To determine whether the credit risk charges are appropriate, we compare the capital requirement with losses over the cycle, focusing on the worst book of business, as these capital requirements aim to make sure the institution has enough capital to withstand a crisis. Some of the loans that have a low default probability in good times might actually perform comparatively worse in bad times.5
Figure 2 shows the credit risk component of the total capital that would be required for each book of business. We included the effects of mortgage insurance but did not account for any CRT credit. We also calculated the projected losses for the same book of business. For the liquidated loans, we used the actual losses. For active loans, we calculated the number of loans delinquent for 180 days or more and then assumed a 65 percent liquidation rate on these loans and a 50 percent loss severity.6 This methodology will not be accurate for recent years but should allow for a fair representation of the stress years going into the Great Recession.
5 For example, if we look at the performance of Fannie Mae full documentation loans from their Loan Level Performance Dataset, we find that loans originated in 2011-Q1 2019 with 700-750 FICOs and 70-80 LTV have gone more than 6 months delinquent (or disposed of via short sales, third-party sales, deeds-in-lieu of foreclosure or real estate owned) at a rate of 0.5 percent; the corresponding number for loans with less than or equal to 700 FICO and greater than 90 LTV was 2.5 percent. By contrast, if we look at loans originated in 2006, the default rate for loans with 700-750 FICOs and 70-80 LTVs was 13.3 percent; the corresponding default rate of loans with less than or equal to 700 FICO and greater than 90 LTV was 27.5 percent. That is, in a benign period (2011 and later origination) the first group was 20 percent as likely to default as the second; however, in a stress period (2006 origination) the first group was 48 percent as likely to default as the second (Goodman et al, May 2020).
6 The Fannie Mae loan level performance data indicates that for 2006-2008, approximately 65 percent of the loans that went 6 months delinquent were liquidated, and the loss severities for the 2006-2007 cohorts were approximately 50 percent, approximately 40 percent for the 2008 cohort (Goodman et al, May 2020).
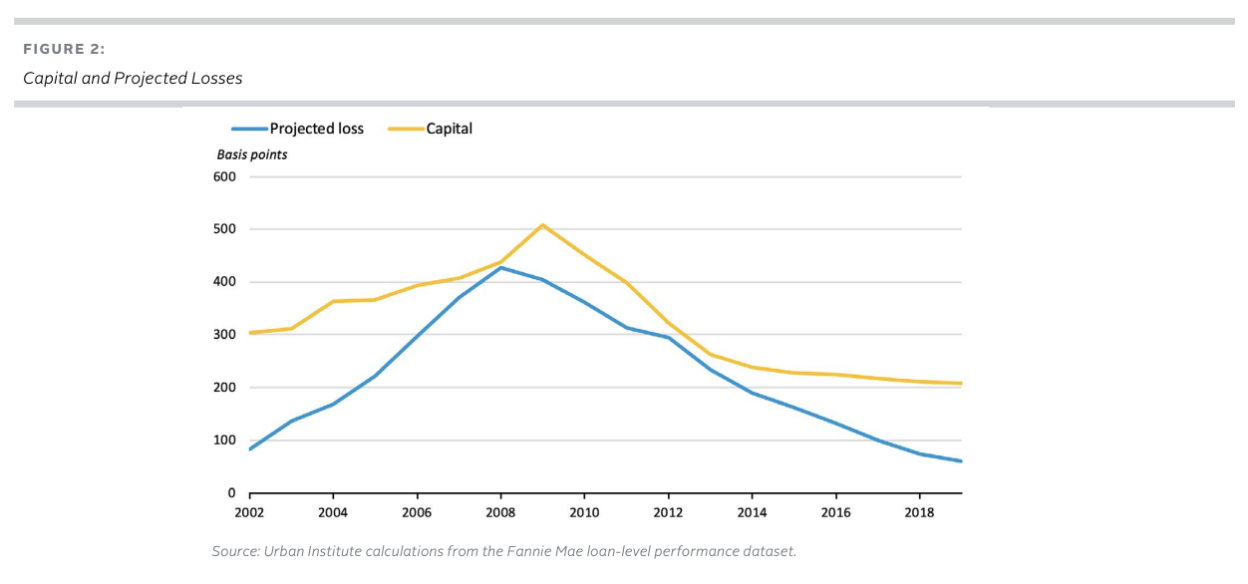
Figure 2: Capital and Projected Losses
The credit risk capital component we calculated above includes a 15 percent minimum and a countercyclical adjustment to the loan-to-value ratios.
The 15 percent minimum raises the capital requirements on low-risk loans. Table 3 shows the count and the share of loans that would be subject to this minimum (between 34 and 64 percent, depending on the year). Thus, on average, 48 percent of loans are subject to the minimum charge. Absent this minimum, these low-risk loans would not have a zero capital charge, but it would be lower than 1.2 percent (15 percent of 8 percent).
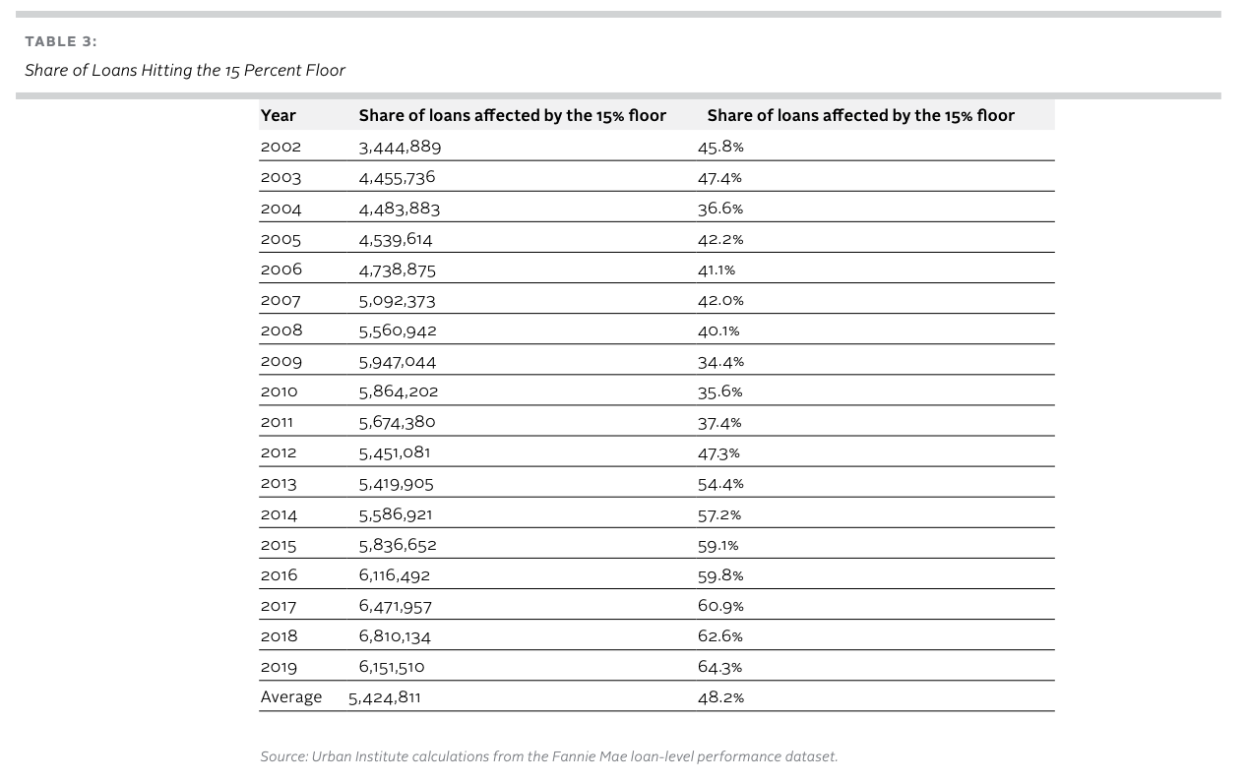
Table 3: Share of Loans Hitting the 15 Percent Floor
Figure 3 compares the impact of this minimum by looking at each book of business with and without the minimum. The minimum adds 21 to 45 basis points per year to the capital charge. On average, the increased capital charge caused by the 15 percent minimum is 36 basis points. It has been higher in recent years, given the less risky book of business. Given the existence of other add-ons for market risk and operational risk, we question whether this minimum is necessary. That is, this risk weight floor is meant to “mitigate the model and other risks associated with the methodology for calibrating the credit risk capital requirements, [and] would also provide further stability to the risk-based capital requirements through the cycle” (FHFA 2020, 56). It seems like a risk weight floor that captures nearly 50 percent of the loans over time drowns out the underlying model. It should be noted that the rationale for the floor on risk-weights is also the rationale for the leverage ratio.
To put this in context, if the 15 percent minimum makes, on average, a 36 basis-point difference in capital requirements, and 48 percent of the loans are affected, then the affected loans, on average, must hold 75 basis points more in capital than they would otherwise be required to do, which is a costly decision. It could cause the loss of many high-quality GSE loans to bank balance sheets, especially 15-year mortgages. To the extent there is excess profit in these loans, it decreases the GSEs’ ability to cross-subsidize certain targeted affordable programs.
We believe a 15 percent loan-level minimum is too high and will, at times, send many high-quality GSE loans to bank balance sheets. We suggest that this loan-level minimum be reduced to no more than 10 percent. This begs the question as to why any floor is needed if there is an absolute leverage ratio incorporated into the discussion. We suggest retaining a floor for two reasons: model error and the fact that a slightly higher capital requirement for the less risky mortgages allows for more cross subsidization within the system.
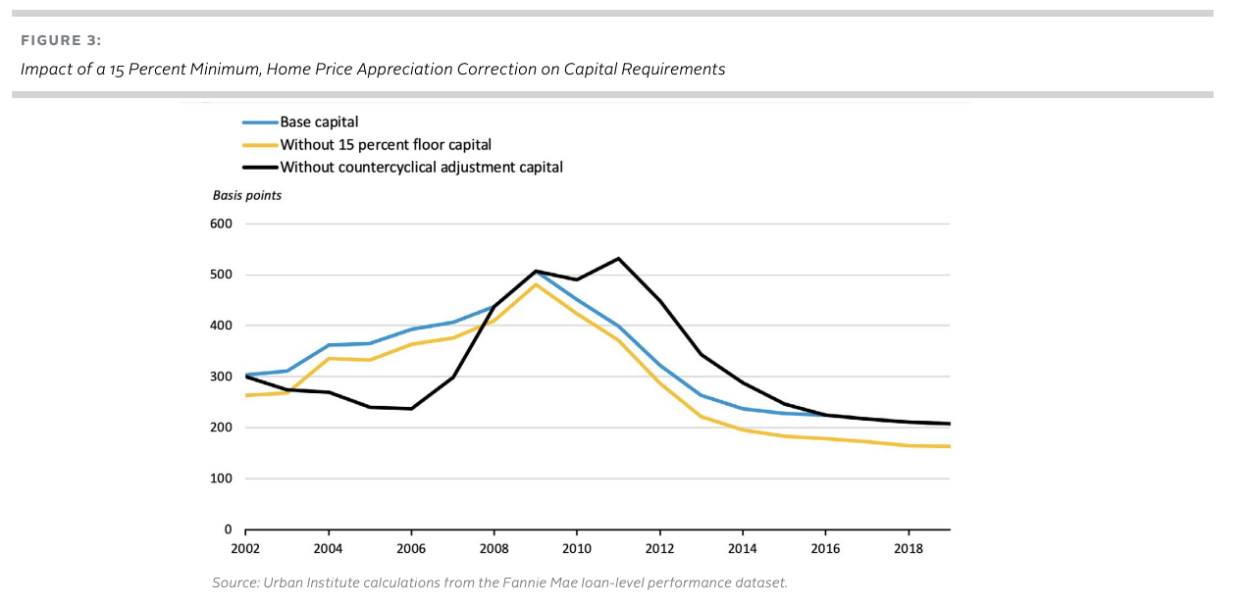
Figure 3: Impact of a 15 Percent Minimum, Home Price Appreciation Correction on Capital Requirements
Under the current proposal, CRT received about half the credit it would have under the 2018 rule. The FHFA’s analysis of the September 30, 2019, book of business shows that under the 2018 proposal, the GSEs would have received $41.3 billion of capital relief; under this proposal, they receive $22.1 billion.
In a post-conservatorship world, in which the entities are looking to maximize return on capital, the GSEs, if subject to these capital requirements, will conduct less CRT than is otherwise economic. This leaves the entities with more risk than otherwise would have been the case. CRT also gives the FHFA and the GSEs information on how the market would price guarantee fees, information that should be valuable for the FHFA and the GSEs in initially setting these fees and loan-level pricing adjustments.
We believe the driver of this result is the 10 percent floor on retained exposures covered by CRT intended to mitigate the potential risks associated with CRT, including the structuring, recourse, and other risks associated with the securitization. Let us consider the sample securitization discussed in the NPR. Assume the risk-based capital on the underlying assets would be 2.75 percent, or $27.5 million for $1 billion in loans. From the bottom to the top, the deal is structured with a size of 50 basis points for the first-loss tranche, a size of 4 percent for the mezzanine tranche, and a size of 95.5 percent for the A tranche.
The GSE retains the first-loss tranche. Assuming an expected 25 basis-point Ioss, the balance has a 1,250 percent capital charge, generating $31.3 million in risk-weighted assets ($2.5 million * 1,250 percent). Ninety-five percent of the mezzanine piece is sold, with 60 percent to the capital markets and 35 percent to reinsurers, generating $86.7 million in RWAs (781 percent risk weight * 0.278 exposure * $40 million). The GSE further retains the A tranche (the top piece), which generates 10 percent risk weight and $95.5 million in RWAs. The total RWAs required on the deal is $213.5 (31.3 + 86.7 + 95.5) million, or 1.7 percent of the capital requirement. The risk reduction on this is small, even though much of the risk is laid off. Also, around 45 (95.5 / 213.5) percent of the capital requirement contribution comes from the 10 percent minimum on the top tranche.
We would suggest a more risk-based alternative. Instead of applying a capital charge to the entire A tranche, apply a capital charge to a portion of the A tranche that would be at risk if losses were twice the capital charge on the underlying mortgages, which is a conservative estimate. The capital charge could be set, conservatively, at half that of the mezzanine capital charge. Using the example above, under our proposal, the A tranche would be further divided into a senior A tranche and a junior A tranche, where the junior portion would have a subordination level of 4.5 percent while the senior portion would have a subordination level of 5.5 percent (2 * 2.75 percent).
Under this framework, the senior A tranche is not subject to a capital charge. The junior A tranche is subject to a capital charge with a risk weight of 391 percent (781 percent / 2). In this case, the capital held for this junior A tranche would be (5.5 percent – 4.5 percent) * 391 percent * 8 percent, or 30 basis points of the mortgage amount. The total RWAs for the deal would be $31.3 million from the first-loss tranche, $86.7 million from the mezzanine tranche, and $39.1 million from the junior A tranche, for a total of $157.1 million, or 126 basis points of capital ($157.1 million * 0.08 capital requirement = $12.6 million of capital, or 126 basis points on the $1 billion of loans). This approach would still be conservative but provides GSEs an incentive to manage risk. In fact, we would expect that in most cases, the GSEs would sell rather than hold the junior A tranche.
We want to emphasize that eliminating the 10 percent charge on the senior A tranche and adopting these suggested changes would still produce a conservative set of CRT requirements. We recognize that the capital treatment for GSE CRT is more generous than what banks receive. That is why banks do not do CRT, even though it would transfer economic risk. The hope would be that, in the next round of Basel changes, the banks would be able to lay off risk and receive capital relief, drawing from the GSEs’ favorable experience with this product.
For multifamily business, Freddie Mac has K-Deals and Fannie Mae has Delegated Underwriting and Servicing (DUS) deals. These deals are different. Freddie Mac transfers almost all the risk of its multifamily business through securitizations, in which Freddie Mac guarantees the senior bonds but not the junior bonds. Thus, Freddie Mac’s credit risk is the risk from loan acquisition to securitization and the ongoing guarantee on the senior bonds. In the DUS structure, Fannie Mae guarantees the senior bonds, and no junior bonds are created. Fannie Mae shares the first loss on the transactions with its lenders, taking about two-thirds of the risk. Some of this risk is subsequently laid off.
The 2020 NPR results in Fannie Mae multifamily capital requirements higher than the Freddie Mac multifamily capital requirements, but the differential is far less than the credit risk differential. Moreover, the 2020 NPR creates significantly higher capital requirements for Freddie Mac but not for Fannie Mae, relative to the 2018 proposal. Freddie Mac’s multifamily capital requirements increase 34 percent, from $5.3 billion to $7.1 billion. Fannie Mae DUS actually sees a small decrease in capital, from $11.6 billion to $10.7 billion.
Much of the capital increase on the Freddie Mac K-Deals is caused by the same issue we highlighted with respect to the CRT deals: the 10 percent minimum on all tranches, including the A tranche. For K-Deals, Freddie Mac wraps this senior piece and sells it into the market, retaining the risk. This means Freddie Mac incurs a high minimum capital charge on bonds that have little risk. We suggest that the FHFA adopts a similar approach to the one we proposed for CRT to ameliorate this issue.
The FHFA, Fannie Mae, and Freddie Mac have spent a considerable amount of time and expense to develop the uniform mortgage-backed security (UMBS), which launched on June 3, 2019. Under the UMBS system, Fannie Mae and Freddie Mac continue to securitize their own loans, but Freddie Mac securities can be included in Fannie Mae resecuritizations (through a megapool or a real estate mortgage investment conduit), and Fannie Mae securities can be included in Freddie Mac resecuritizations. Thus, the securities are fungible. The proposed capital charges threaten this fungibility.
Consistent with the US banking framework, the proposed rule would assign a 20 percent risk weight to the exposures of an enterprise to the other enterprise (other than equity exposures and acquired CRT exposures). The 20 percent risk weight would extend to an enterprise’s exposures to MBS guaranteed by the other enterprise. If Freddie Mac securities were in a Fannie Mae resecuritization, Fannie Mae would have a 20 percent risk weight on the Freddie Mac securities component. Similarly, if Fannie Mae securities were in a Freddie Mac resecuritization, Freddie Mac would have a 20 percent risk weight on the Fannie Mae securities component. Yet, these resecuritizations actually reduce the risk of the GSE model, as they make the credit risk in the joint system and several liabilities of each GSE. In other words, the capital of Fannie Mae stands behind Freddie Mac’s risk, and vice versa. Given this capital charge, we would expect few resecuritizations across GSEs, thereby reducing the liquidity of the UMBS.
Like the 2018 proposal, the 2020 proposal has a FICO/LTV grid with the required capital in each bucket. Multipliers are applied to this for varying borrower and mortgage characteristics. This proposal makes several improvements to the 2018 proposal. In particular, it eliminates the multiplier for single borrowers and the multiplier for smaller loan size.
But there are certain distortions baked into the relative relationships, which can be seen by comparing the capital charges with the losses on the December 2008 book of business, the worst book of business, using the methodology described earlier. Note that for liquidated loans, the calculation uses actual losses, and for liquidated loans with mortgage insurance, the loss calculation is the loss to the GSEs net of the mortgage insurance recovery. This analysis reflects mortgage insurance proceeds actually received by Fannie Mae; it is based on loan level recoveries calculated from the Fannie Mae loan level performance dataset. As we are looking at the 2008 book of business, which was underwritten before Private Mortgage Insurer Eligibility Requirements went into effect, we are not considering any improvements in mortgage insurance recoveries as a result of these policies.
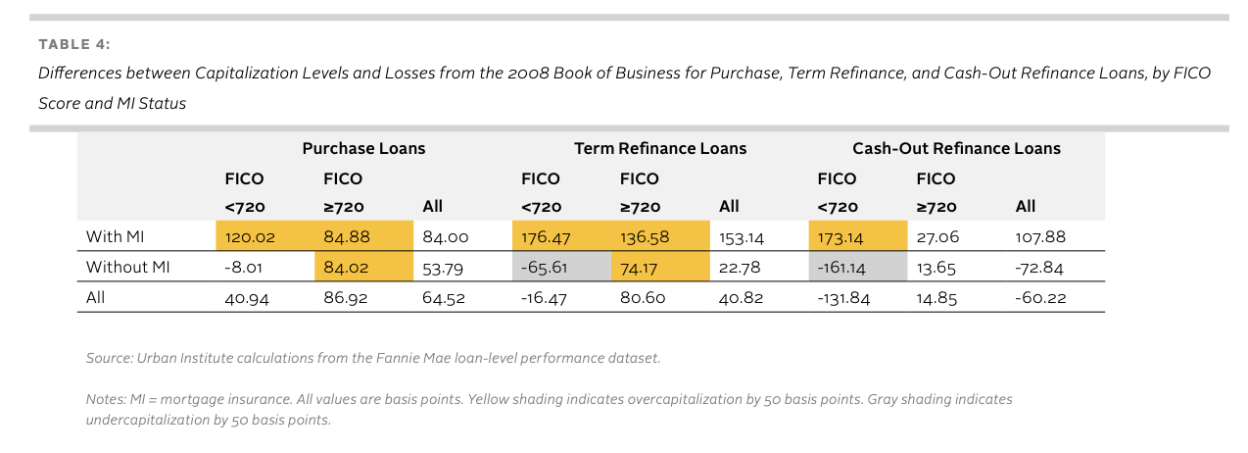
Table 4: Differences between Capitalization Levels and Losses from the 2008 Book of Business for Purchase, Term Refinance, and Cash-Out Refinance Loans, by FICO Score and MI Status
Table 4 shows that the capital requirements are uniformly too high for purchase loans (390 basis points of capital versus 325 basis points of projected losses, or a 64.52 basis-point overcapitalization) and for rate-and-term refinances (387 basis points of capital versus 346 basis points of losses, or a 40 basis-point overcapitalization). In contrast, they are too low for cash-out refinances (525 basis points of capital versus 586 basis points of losses, or a 60 basis-point undercapitalization). It does not make sense for purchase and rateand-term refinances to subsidize cash-out refinances.
We do know that the performance of rate-and-term and cash-out refinances has improved postcrisis, but our calculations show that the capital charges of cash-out refinances still cannot cover their projected losses.7 That is, even with an improved appraisal process and greater reliance on automated valuation models, rate-andterm refinances were still 11 percent riskier than purchase loans with the same characteristics, while cash-out refinances were 55 percent riskier. The proposed capital requirements, taken into account in the calculations above, have a multiplier of 1.3 for performing rate-and-term refinances and 1.4 for performing cash-out refinances.
Within the purchase and rate-and-term refinance arenas, mortgages that require mortgage insurance uniformly require a higher capital charge than their losses would indicate. This suggests that inadequate credit is being given to mortgage insurance. In addition, for mortgages with no mortgage insurance, the borrowers with high FICO scores are overcapitalized relative to the borrowers with low FICO scores.
It was not clear to us how the FHFA calculated its capital charges across borrower and product characteristics. We recommend the FHFA publish a white paper on how it did its calculations. This transparency would allow for a more targeted set of comments and would allow for better monitoring of when it might be time to update the multipliers as industry practices change.
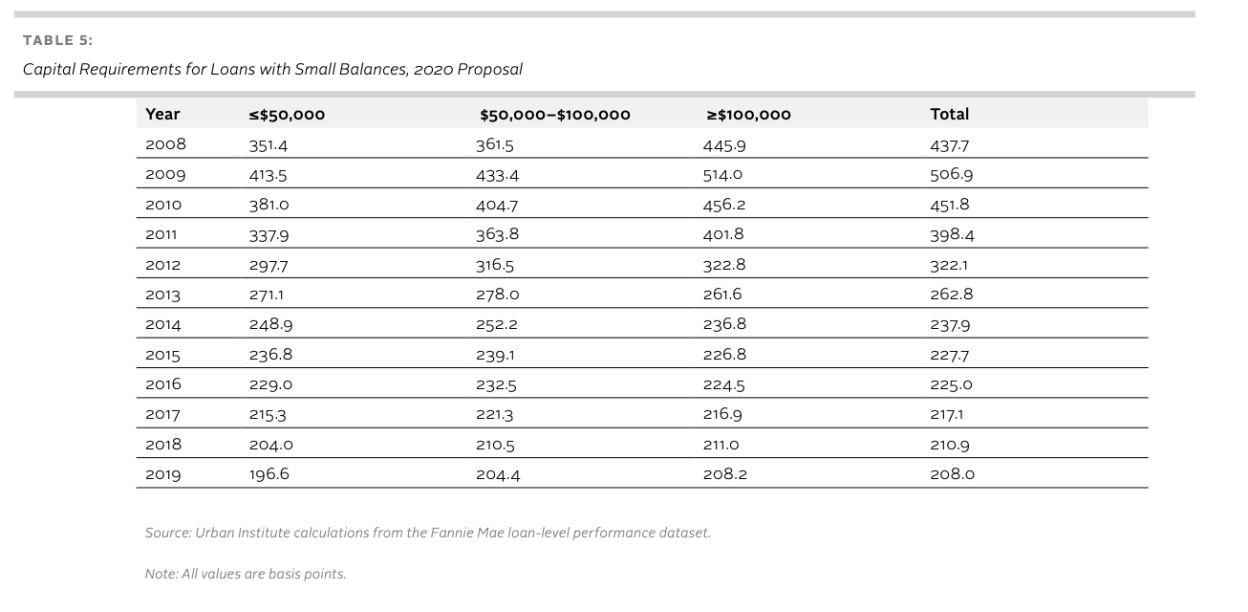
Table 5: Capital Requirements for Loans with Small Balances, 2020 Proposal
Capital Allocation by Borrower Characteristics: Small Loans
The 2018 proposal contained an extra multiplier for small loans. Loans with balances less than $50,000 would have had risk weights 23 percent higher than loans with balances greater than $100,000. Loans with balances between $50,000 and $100,000 have a risk weight 15 percent higher than loans with balances greater than $100,000. The 2020 NPR eliminated this. Postcrisis, small loans have lower risk weights than large loans, as their loan-level characteristics are stronger (table 5). We view this as a positive change. Similarly, the 2018 NPR had a multiplier for single borrowers, which the 2020 NPR also eliminated—another positive change from a public policy perspective.
The proposal also includes a countercyclical adjustment to the LTV ratios. This adjustment estimates a trend line for real annual home price appreciation (HPA) from 1975 to 2012. When home price changes are outside of a 5 percent band of this trend line, the countercyclical adjustment adjusts prices to pull them back to the 5 percent maximum deviation, in turn affecting the mark-to-market loan-to-value ratio. When home prices are within 5 percent of the trend line, no adjustment is necessary, which was the case in 2008 and 2019 (figure 4, 1975 to 2012 estimation sample). From 2003 to 2007, prices were above the trend line, and the countercyclical adjustment lowered house prices and raised MTMLTV ratios for calculating the capital requirement. Without the adjustment, the amount of capital required would have been lower. Similarly, from 2010 to 2015, prices were below the trend line; the countercyclical adjustment raised prices and lowered MTMLTV ratios. Without the adjustment, the amount of capital required would have been higher.
One of our comments on the 2018 NPR on enterprise capital was that it was too procyclical. The 2020 NPR seeks to avoid that problem through the countercyclical adjustment to home prices. Moreover, by using a long period, the countercyclical adjustment does not seem to be that sensitive to the choice of the period. We ran the analysis from 1985 to 2019, rather than from 1975 to 2012, as the FHFA did. The differences in the year-byyear adjustments are shown in figure 4. Moving the period results in a slightly lower trend line, which means that undervaluations are corrected less and overvaluations are reduced more. Thus, there would be a small downward adjustment for 2019, rather than no adjustment. Even so, the differences are small.
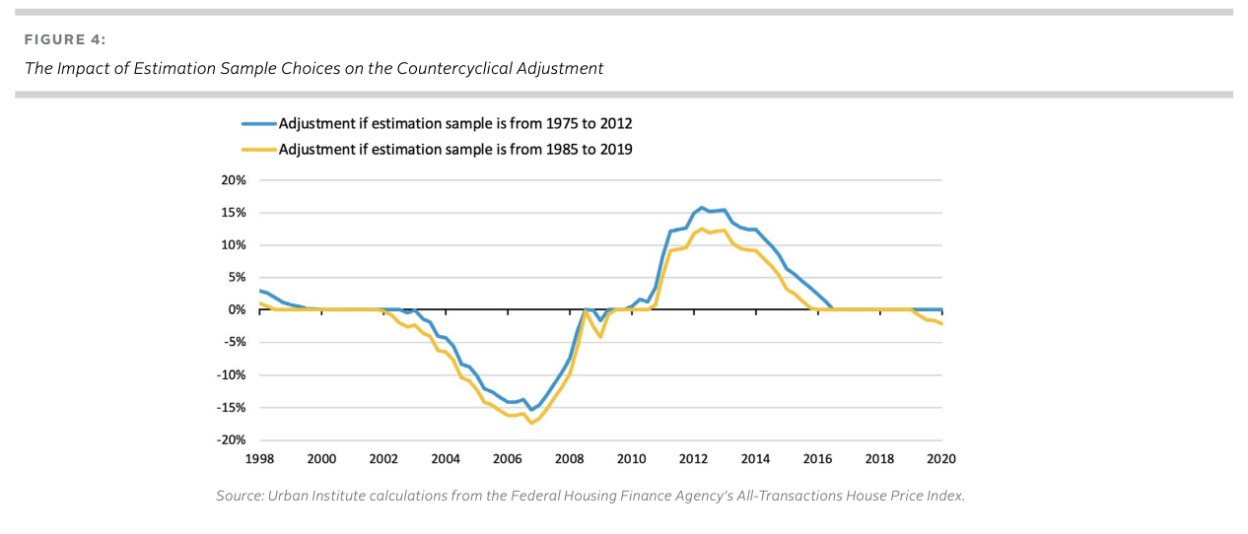
Figure 4: The Impact of Estimation Sample Choices on the Countercyclical Adjustment
The biggest issue is that as you go further out of the sample, the effects become troublesome. For example, if the rise in home prices since 2012 is caused by a persistent supply shortage, which could get worse, assuming the long-term trend will reverse itself would yield a credit policy that is too restrictive. And in years in which the correction is sizeable, the GSEs may be reluctant to do high-LTV mortgages, preferring to see that business go to the FHA. Even today, when pricing high-LTV lending, the GSEs would need to account for the fact that future real HPA will not count as an offset to capital. At the margin, even with no current adjustment to the MTMLTV ratio, it is likely to affect their willingness to do this business.
There are several solutions to address this concern. The FHFA could consider a wider collar, at least above the trend line, and less than a 100 percent adjustment when the current year is above the trend line. Figure 5 shows the impact of allowing for a 7.5 percent collar above the trend line rather than a 5 percent collar. We are advocating adjustments that are not symmetric to encourage more lending during periods of home price declines (i.e., allowing for a 7.5 percent band above the trend line and a 5 percent band below the trend line) or, when the HPA for a given year is above the corridor, give credit for half the incremental real HPA. When HPA is below the corridor, make the full upward adjustment. We believe that when home prices are below the trend line, it often corresponds to periods when others have pulled out of the market, and the GSEs should be more aggressive. In fact, their charter would suggest that this countercyclical presence is one of their roles.
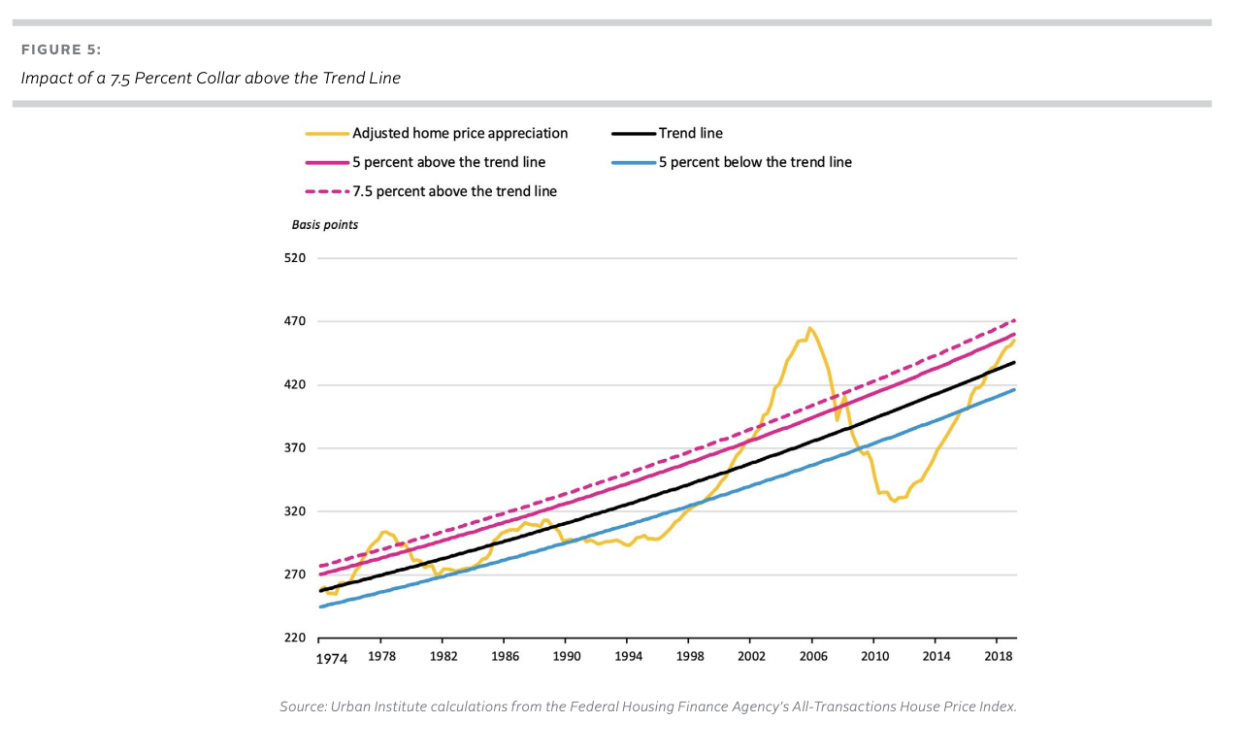
Figure 5: Impact of a 7.5 Percent Collar above the Trend Line
An additional issue is that home price movements are not equal across the country. Home price appreciation may be far higher in Dallas than in Des Moines or Chicago. Moreover, home price volatility could be higher in certain markets than in others. We believe the GSEs have tools in their underwriting toolkit to deal with overheated markets, and it does suggest the need to continue to monitor this adjustment. A “set it and forget it” approach will prove unsatisfactory. We suggest that the FHFA, in consultation with the Federal Reserve, retain the right to reevaluate the adjustment every few years to make sure it does not unreasonably inhibit lending both nationwide and in local markets.
The 2020 NPR requires higher capital requirements than the 2018 proposal, with the credit risk–based capital alone well in excess of the worst year of business in 2008. In addition, the credit risk component constitutes less than 50 percent of the total risk-based capital requirement. This will invariably increase guarantee fees. We question whether this level of capital makes sense.
In addition, the Basel-like structure of the capital requirements is complicated and results in the absolute leverage requirement being the binding constraint for Tier 1 capital in recent years. This means the GSEs have little incentive to off-load risk through CRT, and this will lessen their attention to risk. We suggest that the FHFA focus on producing a risk-based capital requirement that is better tailored to the risk and missions of these monoline entities.
We suggest a less complicated capital structure and somewhat lower capital requirements. In addition, while the GSEs are in conservatorship, the role of the Preferred Stock Purchase Agreements (PSPAs) cannot be ignored, as the FHFA has done in this proposal. Once the GSEs are out of conservatorship, there will more likely be a periodic commitment fee to pay for the implicit guarantee, similar to the Federal Deposit Insurance Corporation insurance premium for the banking sector. The interplay between the PSPAs or periodic commitment fee and this capital structure needs to be thought through carefully. The higher the commitment fee, the lower the capital requirement can be. It is the safety net (the Federal Deposit Insurance Corporation and the Federal Reserve discount window) that allows banks to survive downturns, not solely “fortress” balance sheets. In addition, we suggest cutting the leverage requirement from 2.5 percent to no more than 2 percent. We also suggest cutting the buffer from 1.5 percent to no more than 1.0%; these actions will make the risk based capital requirements the binding constraint more of the time.
We are also concerned about the size and construction of the capital buffers in the risk-based capital rules. The stability buffer places a heavy penalty on increases in market share through a high marginal capital requirement, limiting the GSEs’ ability to play a countercyclical role. We suggest setting this buffer to a fixed number, no higher than 50 basis points, rather than the current approach. This is only one of the three capital buffers: the stress capital buffer is set at 75 basis points, and the countercyclical buffer is set at zero basis points. If the stability buffer was set at 50 basis points, the total risk based capital buffer would still be 125 basis points for both Fannie Mae and Freddie Mac. We showed a 1 percent buffer would provide FHFA plenty of time to use prompt corrective action to reduce dividends and bonuses as losses eroded the buffer.
We believe that these capital rules are often inconsistent with the original mission of the organizations. We applaud the enhancements from the 2020 NPR, such as the elimination of the small-loan and single borrower multipliers. We argue that, under the current NPR, capital on purchase loans, especially high-LTV purchase loans, is well higher than historical loss experience. That is, the capital requirements on purchase loans should be lower, and more credit should be given to mortgage insurance. We showed earlier in this paper that the capitalization levels for loans with mortgage insurance are well in excess of the losses of the worst year book of business, 2008 for all loan purposes: purchase, rate/term refinance and cash out refinance. In addition, these loss calculations were based on a book of business prior to the adoption of PMIERs, which should reduce the GSE exposure to the credit risk of the mortgage insurers. One way to do this is to count the loan-level price adjustments on purchase loans toward Tier 2 capital. More transparency on the FHFA’s approach to these capital requirements would have allowed for a more nuanced solution.
We suggest reducing the 15 percent loan-level minimum on both single-family and multifamily loans to no more than 10 percent. The 15 percent loan-level-minimums rule makes the risk-based capital requirements less risk based. We do believe that some floor is necessary, both because of model risk and because it encourages some level of cross-subsidization within the market.
We believe the amount of capital credit given for risks laid off through CRT is too low. We suggest eliminating the 10 percent minimum for all securitized tranches, as some of the bonds have no risk. We propose a more risk-based alternative in this paper by holding capital only on the part of the A bonds that could conceivably suffer a loss. We suggest applying this methodology to Freddie Mac K-Deals as well, as they suffer from the same issue.
Finally, we are concerned about the MTMLTV adjustment, especially that putting it on autopilot will constrict lending. We suggest a partial adjustment for real HPA, at least when house prices are above the corridor. In addition, we suggest an asymmetric corridor. For example, house prices could float 7.5 percent above the trend line (a 7.5 percent collar) and 5 percent below the trend line (a 5 percent floor). This would better support the market during a downturn. We would also support a periodic reevaluation of this adjustment, done jointly by the FHFA and the Federal Reserve, to ensure it is not unduly constraining lending nationally or in specific geographic areas.
But the first fix has to be lowering the Tier 1 leverage ratio to no more than 2 percent, and to lower the buffer on the leverage based requirements, so that these requirements are less likely to be the binding constraint.
Our recommendations should be considered a package that better aligns capital to risk. We have recommended numbers that we believe do not reduce the overall rigor or stringency of the capital standard but does not produce the distortions in behavior that we believe these requirements will generate. We believe that better tying capital to risk will result in a better-regulated and stronger mortgage finance system.
Allen, D. E., McAleer, M., Powell, R. J., & Singh, A. K. (2016). Down-side risk metrics as portfolio diversification strategies across the global financial crisis. Journal of Risk and Financial Management, 9(2), 6.
Federal Housing Finance Agency. 2020. Enterprise Regulatory Capital Framework: Notice of Proposed Rulemaking. Washington, DC: Federal Housing Finance Agency. (2020a)
Federal Housing Finance Agency. 2020. Re-Proposed Rule on Enterprise Capital: Overview of Proposed Rulemaking. Washington, DC: Federal Housing Finance Agency. (2020b)
Golding, Edward, Laurie Goodman, and Jun Zhu. 2018. “Analysis of the FHFA’s Proposal on Enterprise Capital.” Washington, DC: Urban Institute.
Goodman, Laurie, Alanna McCargo, Jim Parrott, Jun Zhu, Sheryl Pardo, Karan Kaul, and Michael Neal, et al. 2020. Housing Finance at a Glance: A Monthly Chartbook, May 2020. Washington, DC: Urban Institute.
Goodman, Laurie, Alanna McCargo, Jim Parrott, Jun Zhu, Sheryl Pardo, Karan Kaul, and Michael Neal, et al. 2020. Housing Finance at a Glance: A Monthly Chartbook, July 2020. Washington, DC: Urban Institute.
Goodman, Laurie and Jun Zhu, “A Significantly Improved Appraisal Process Has Reduced the Riskiness of Refinance Mortgages,” Urban Wire (blog), Urban Institute, March 7, 2019,
Stiroh, Kevin J., and Adrienne Rumble. “The dark side of diversification: The case of US financial holding companies.” Journal of banking & finance 30.8 (2006): 2131-2161.
Providing expert commentary on urban topics and highlighting Penn IUR's research in the context of pressing urban issues.