Article
Urban Link
Geography of Fiscal Distress in America
September 21, 2020
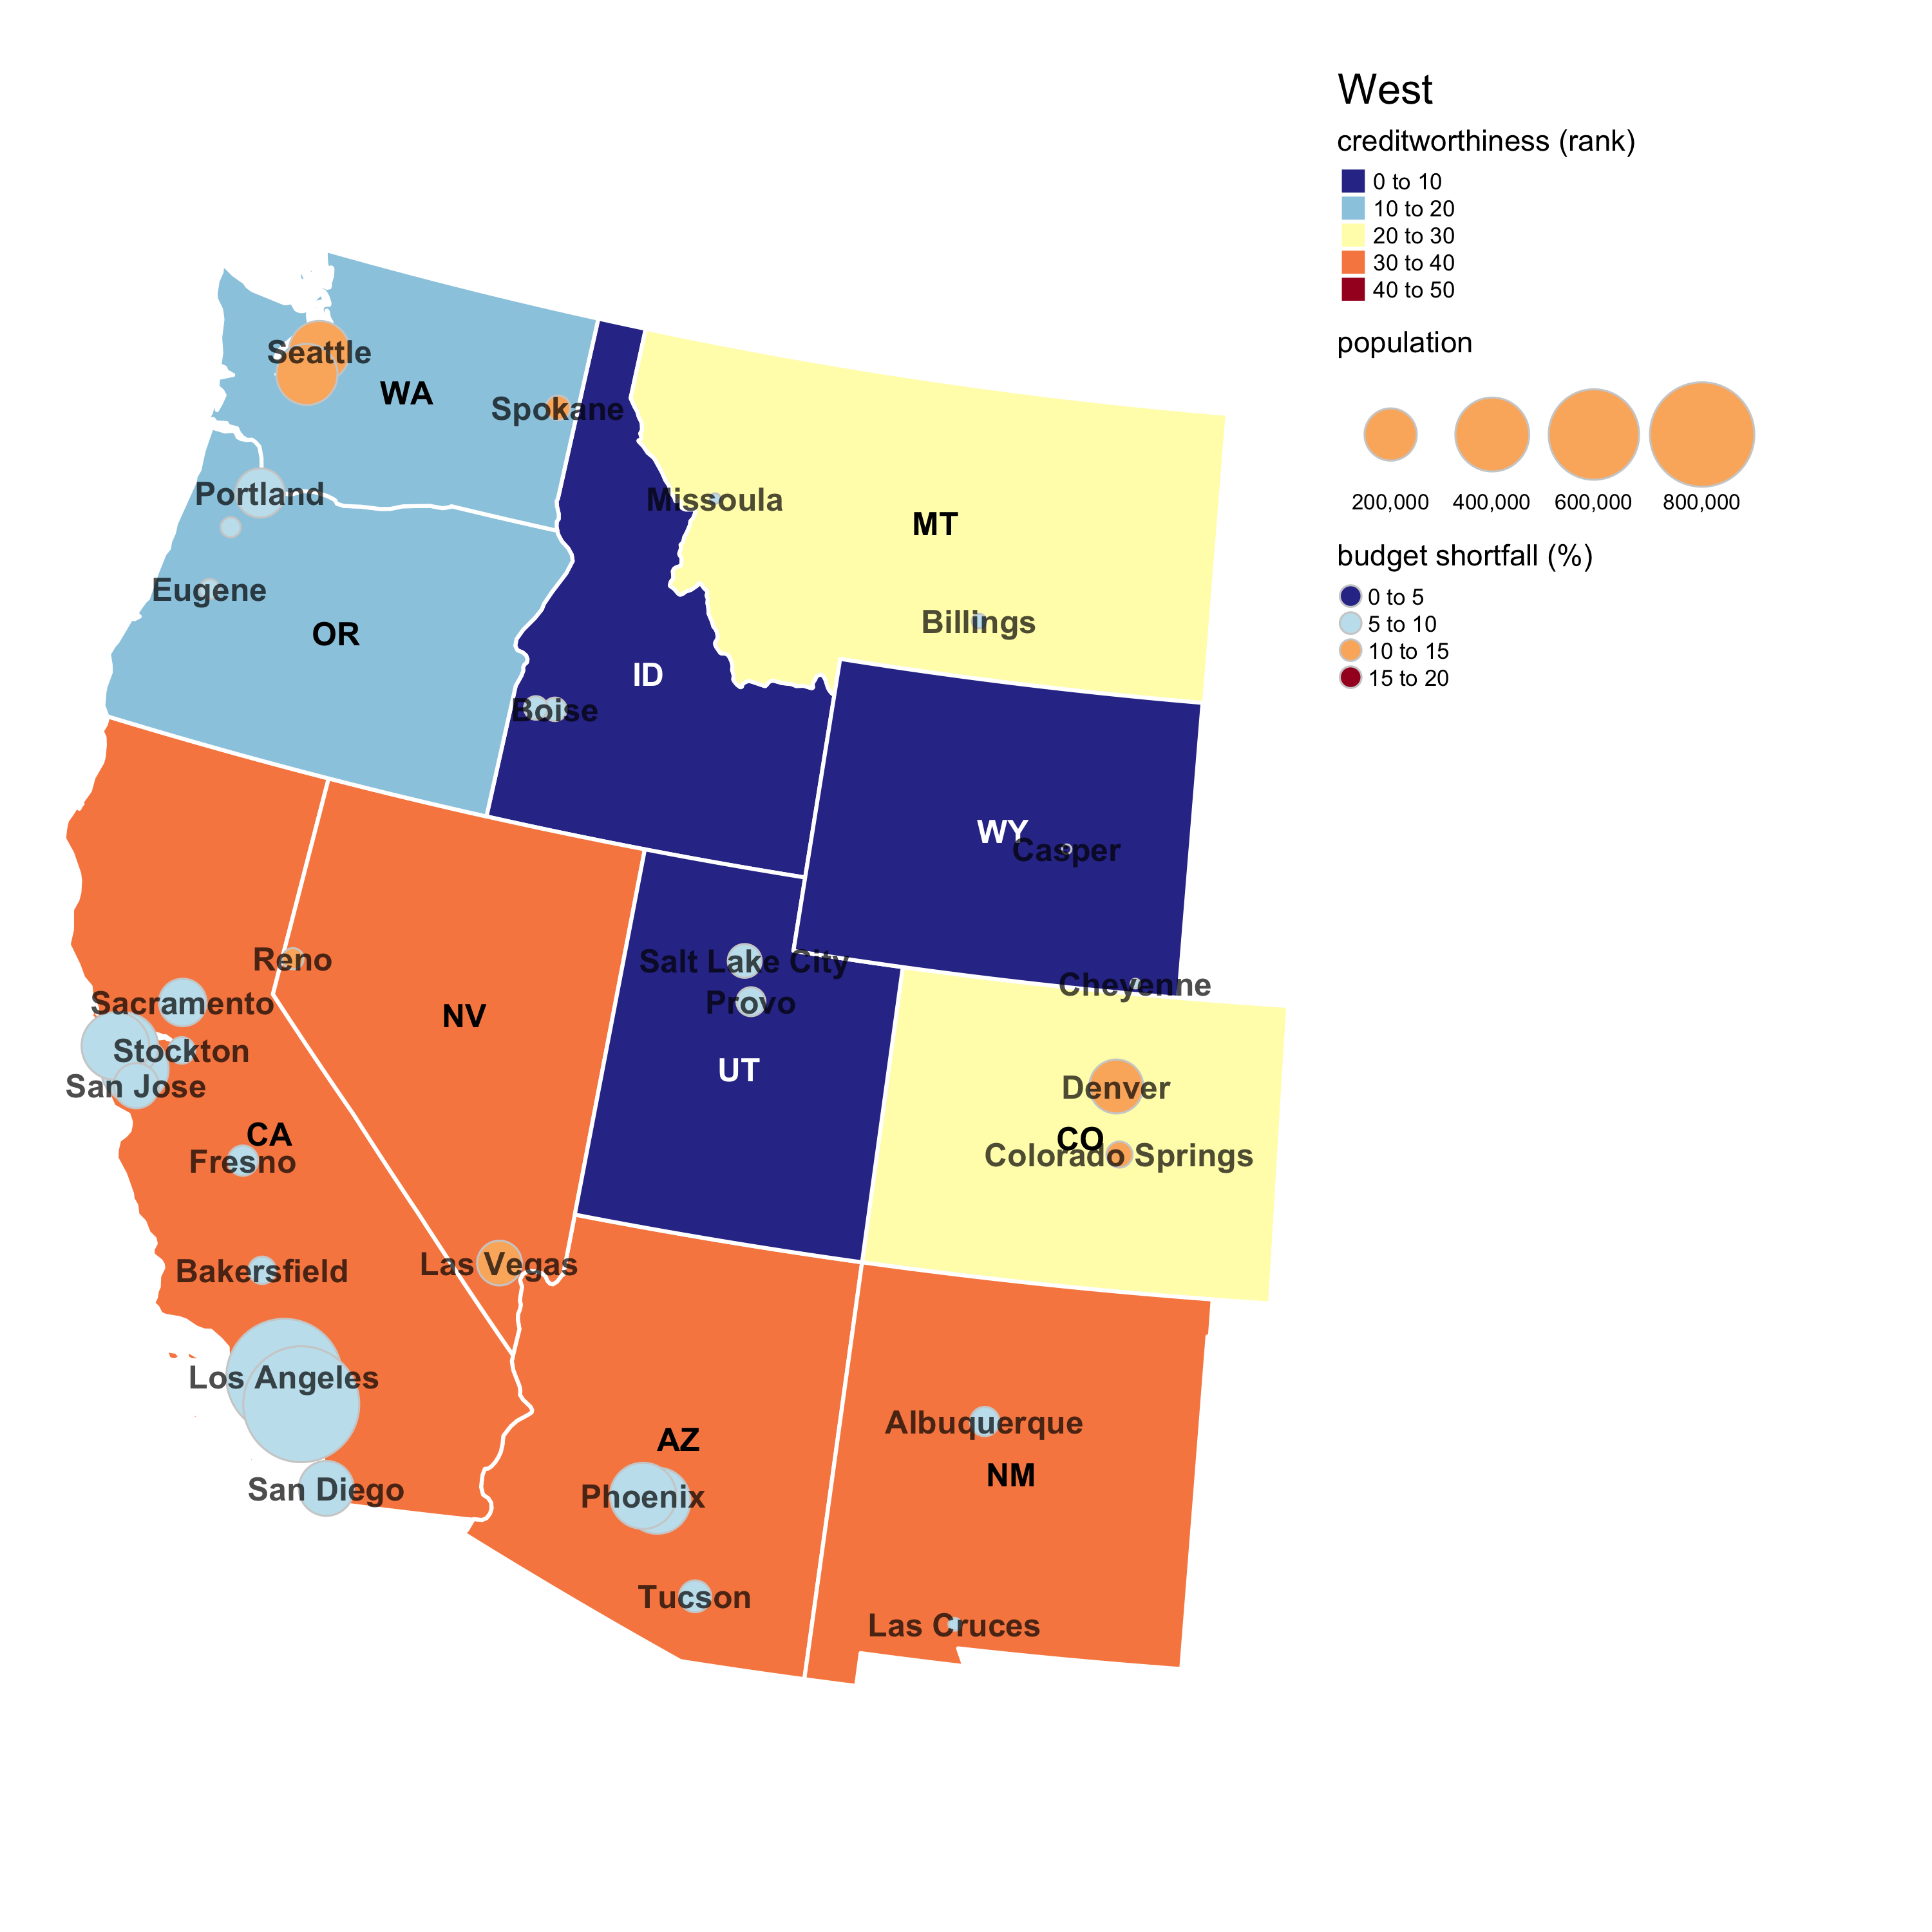
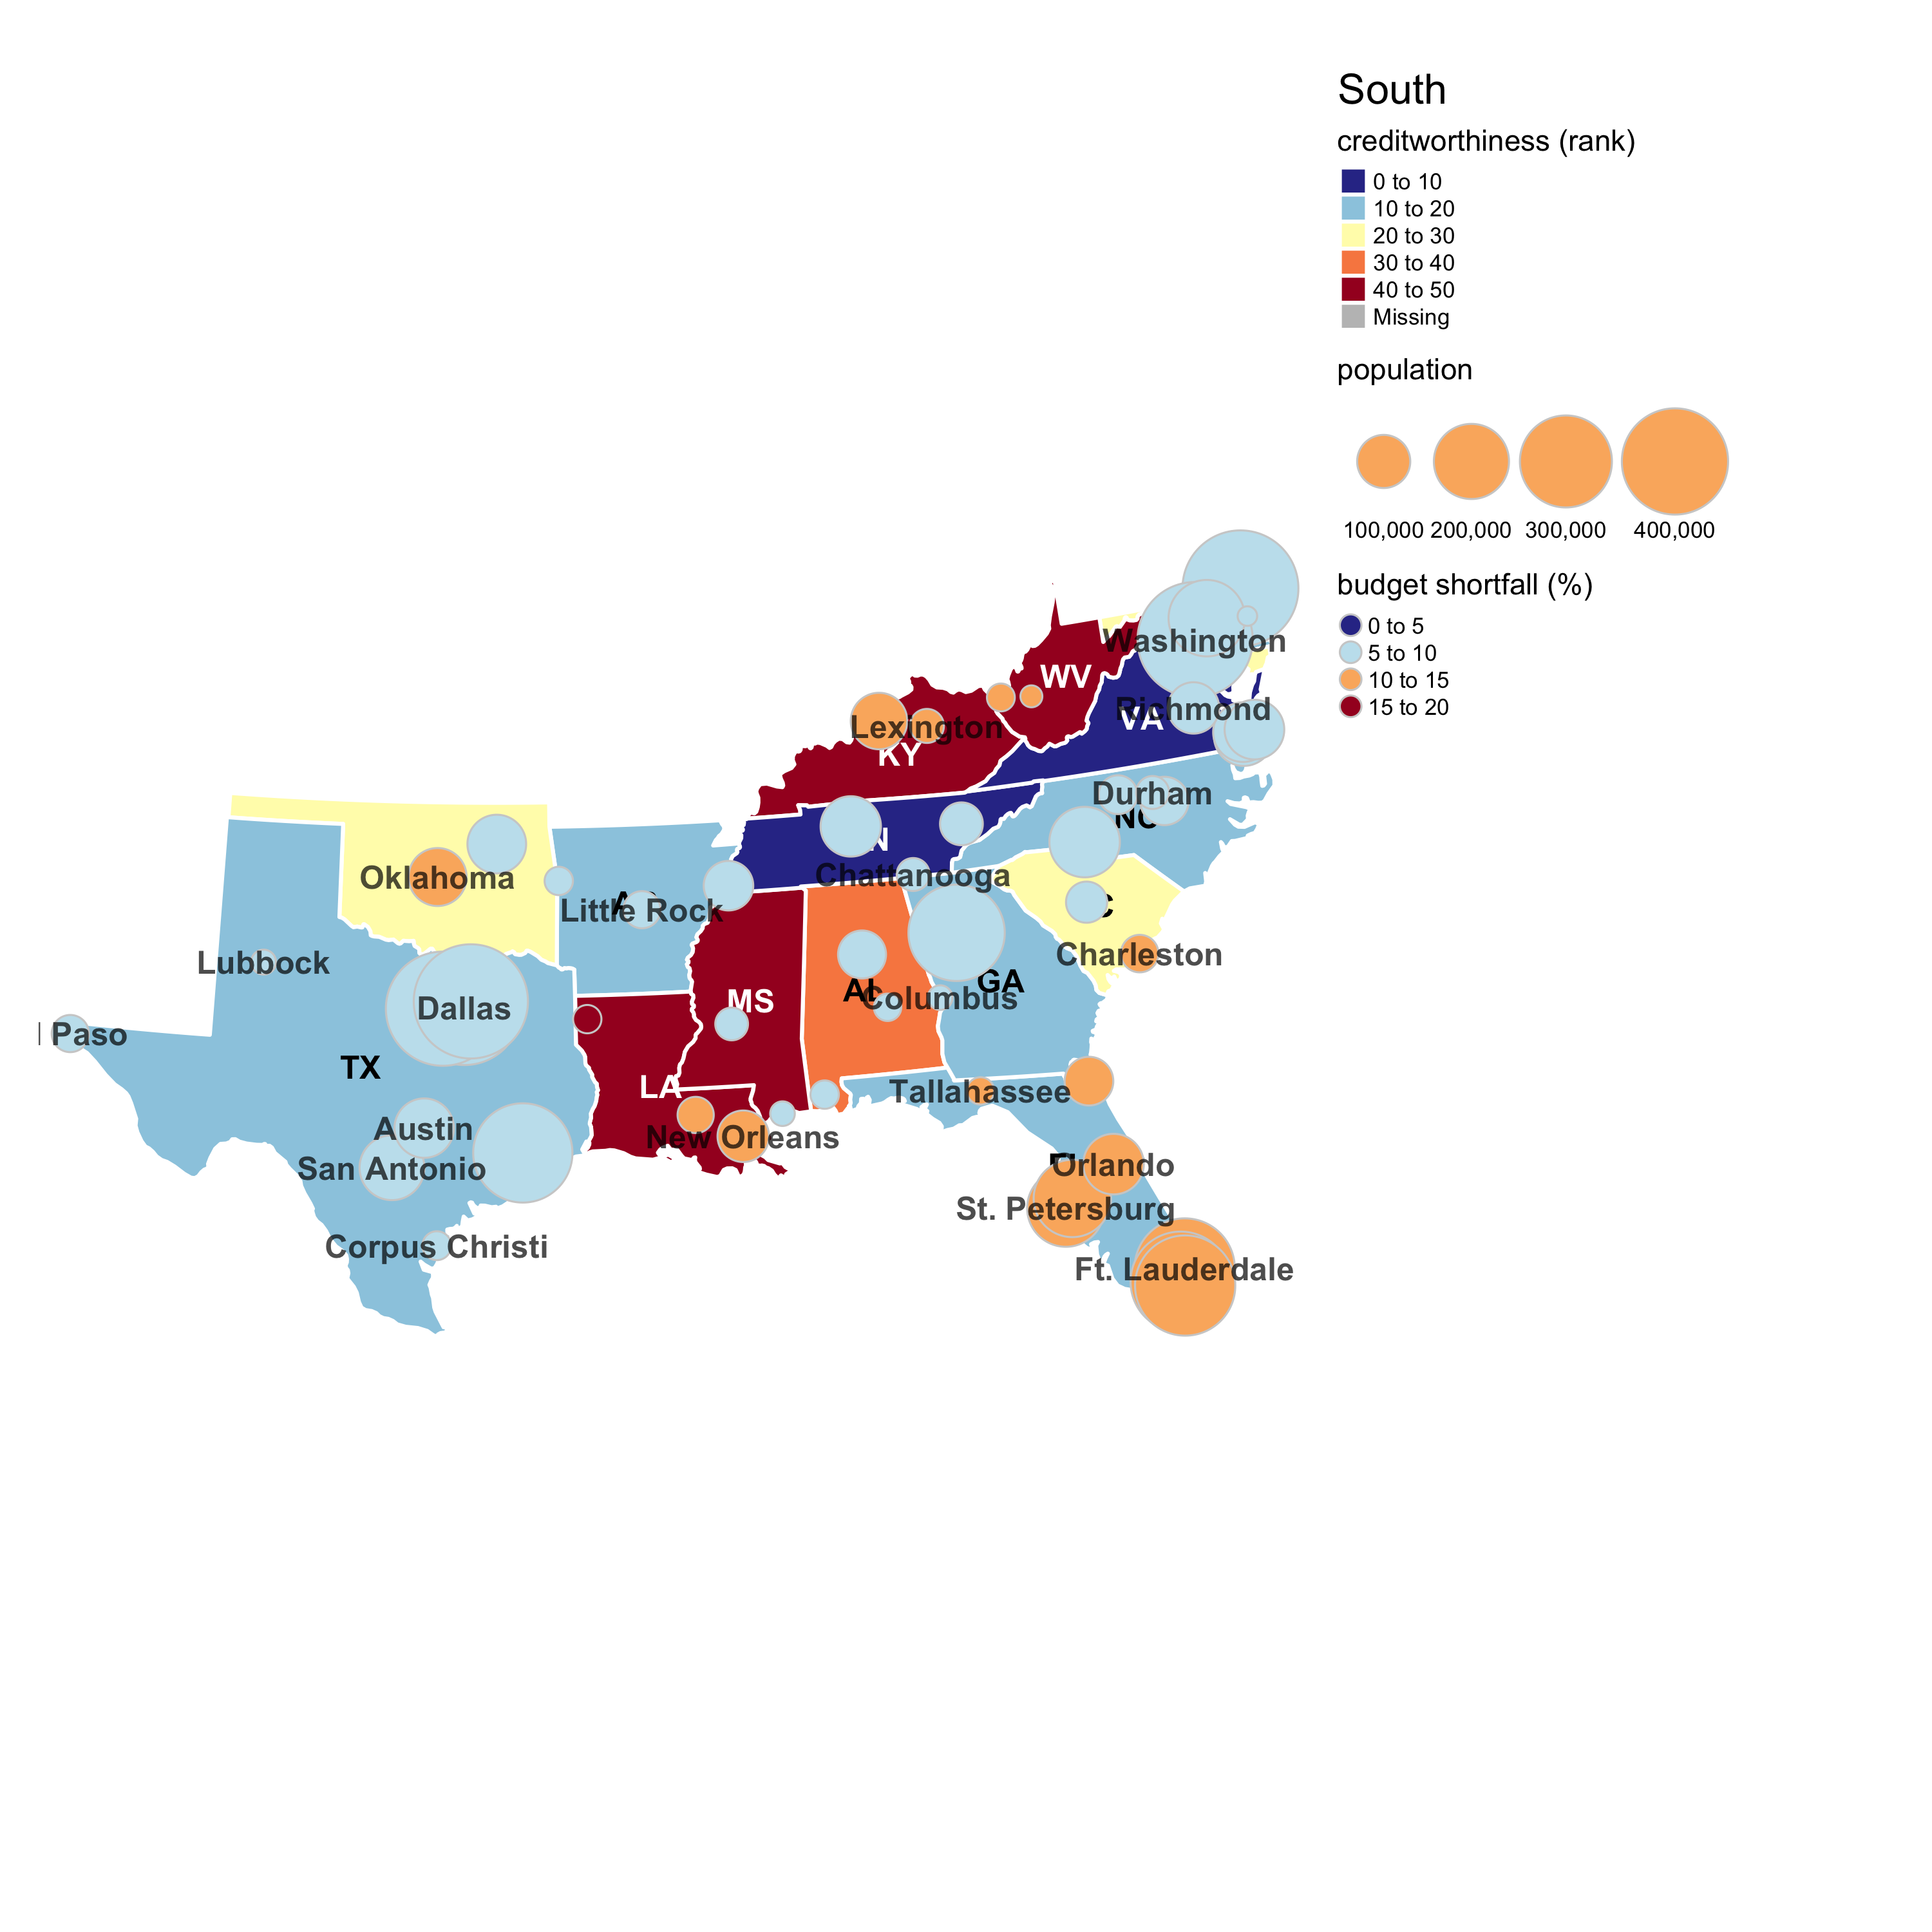
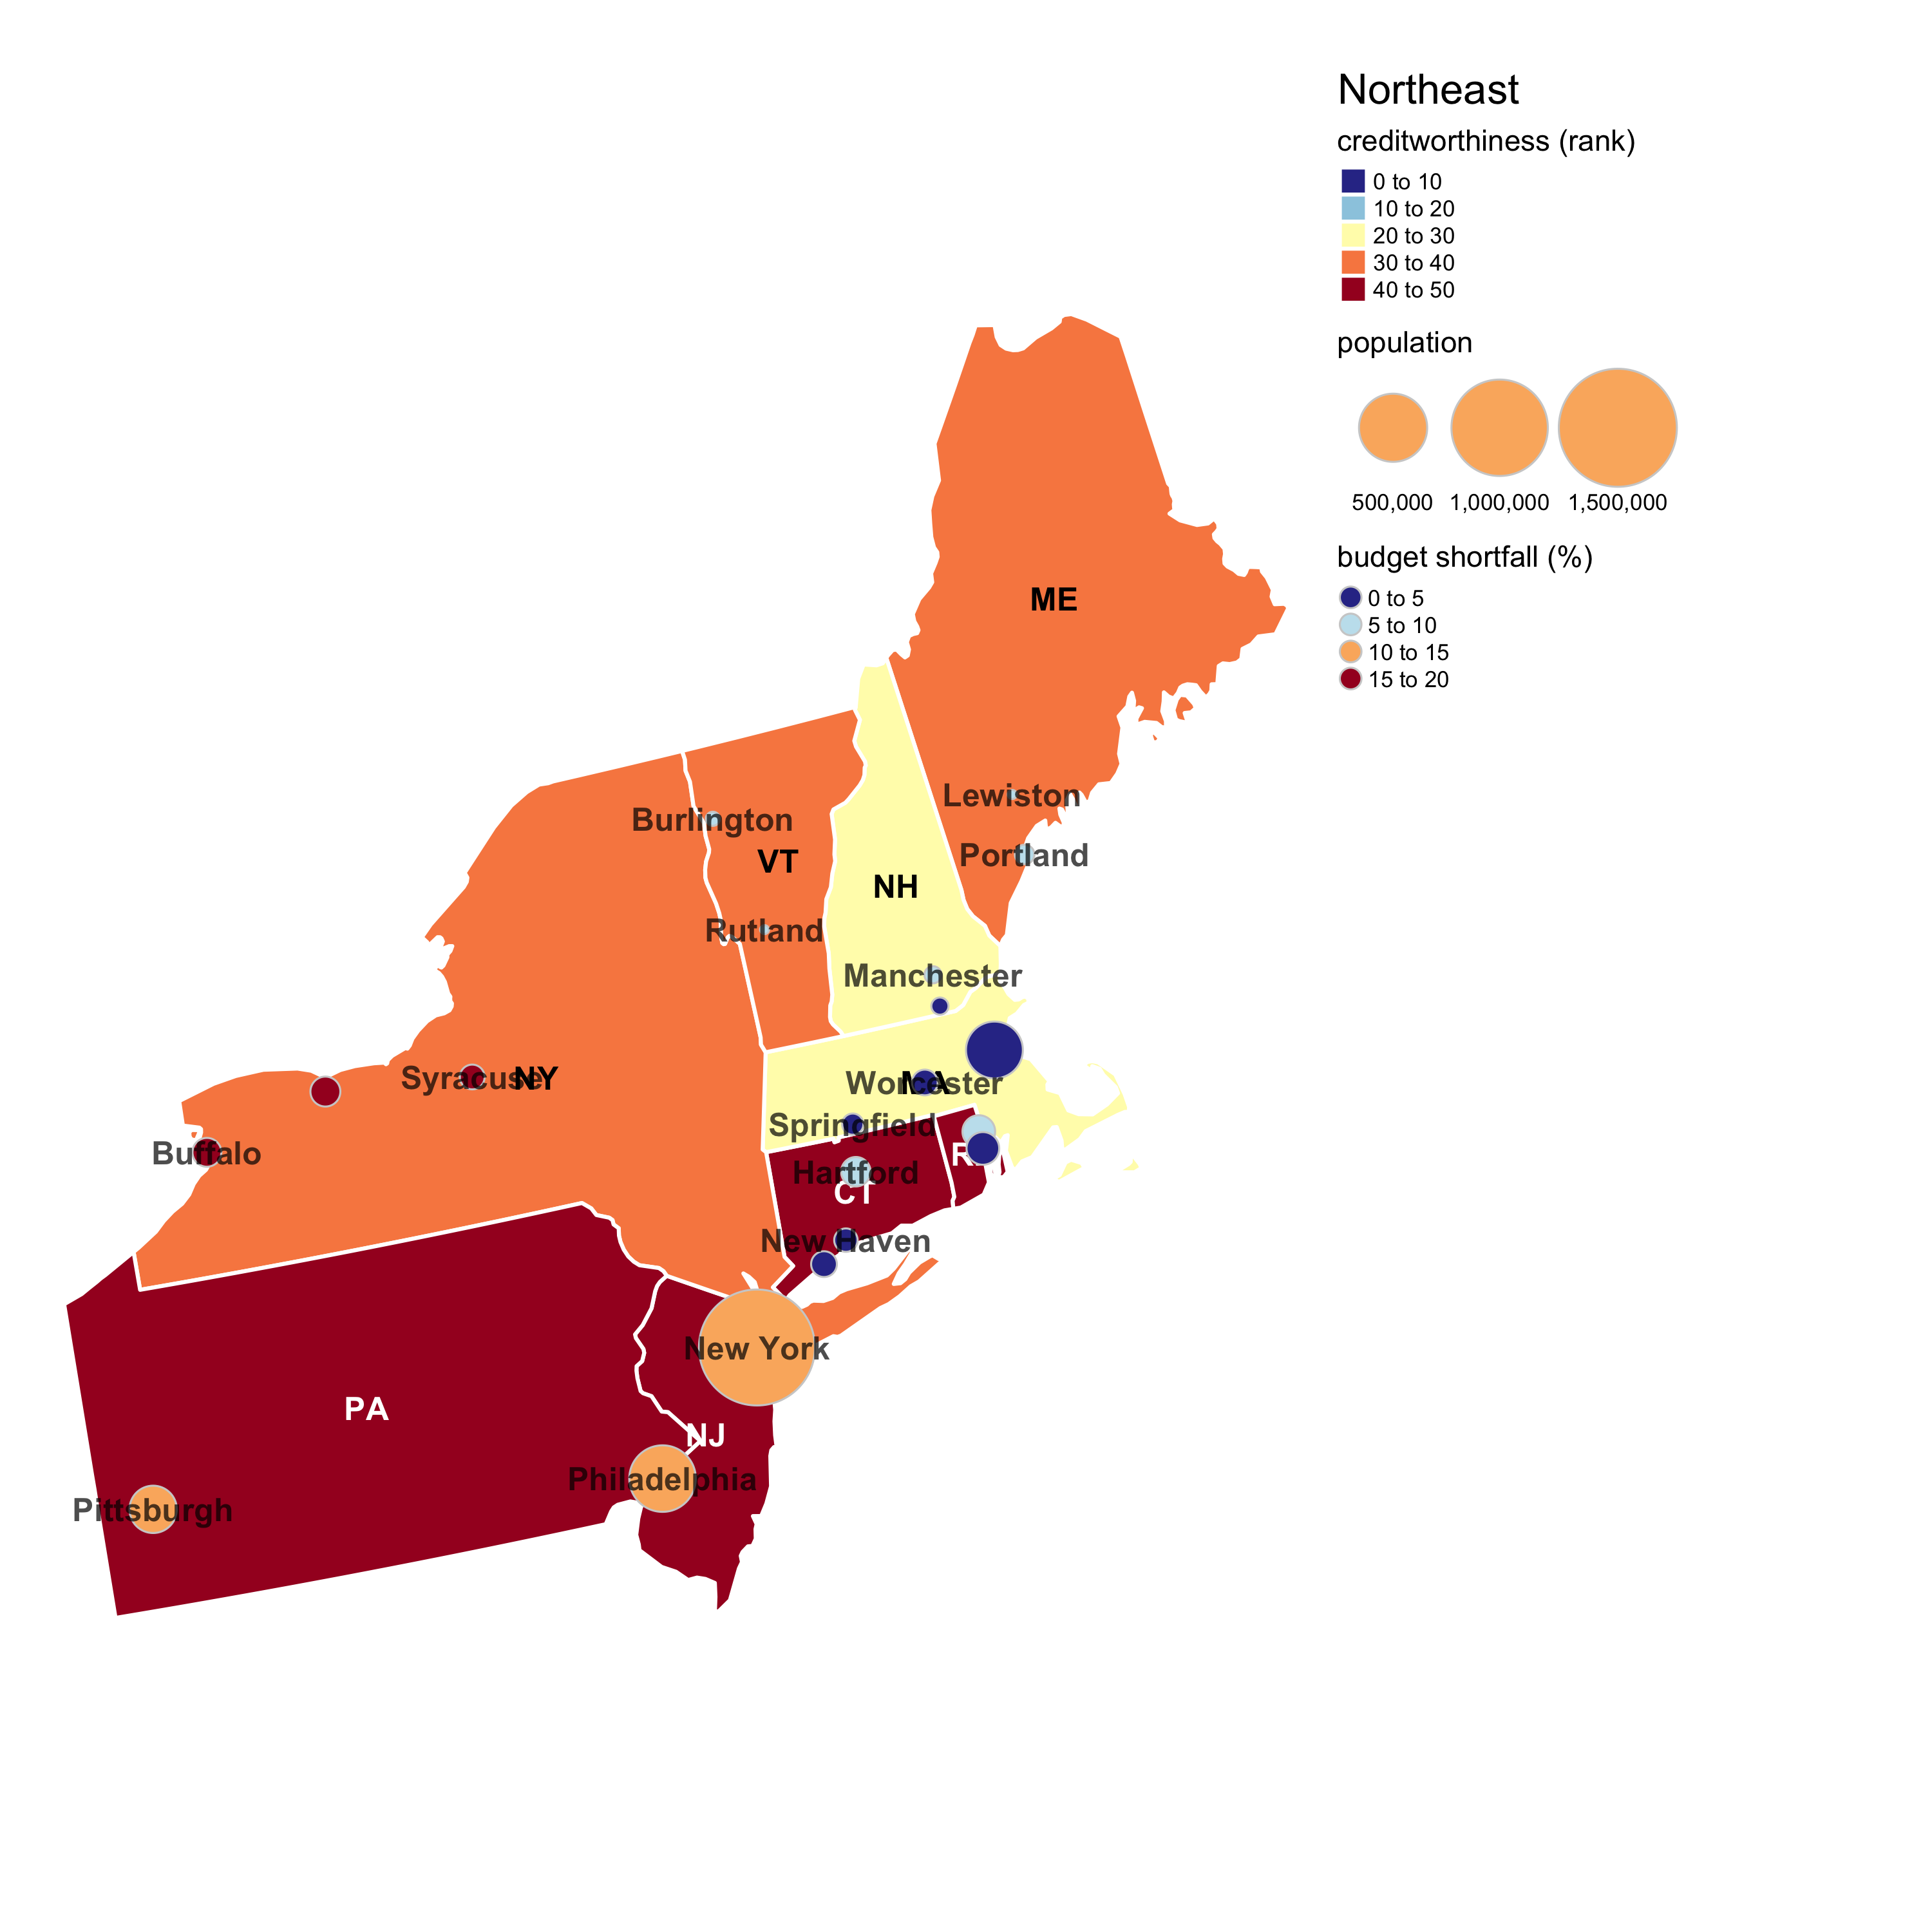
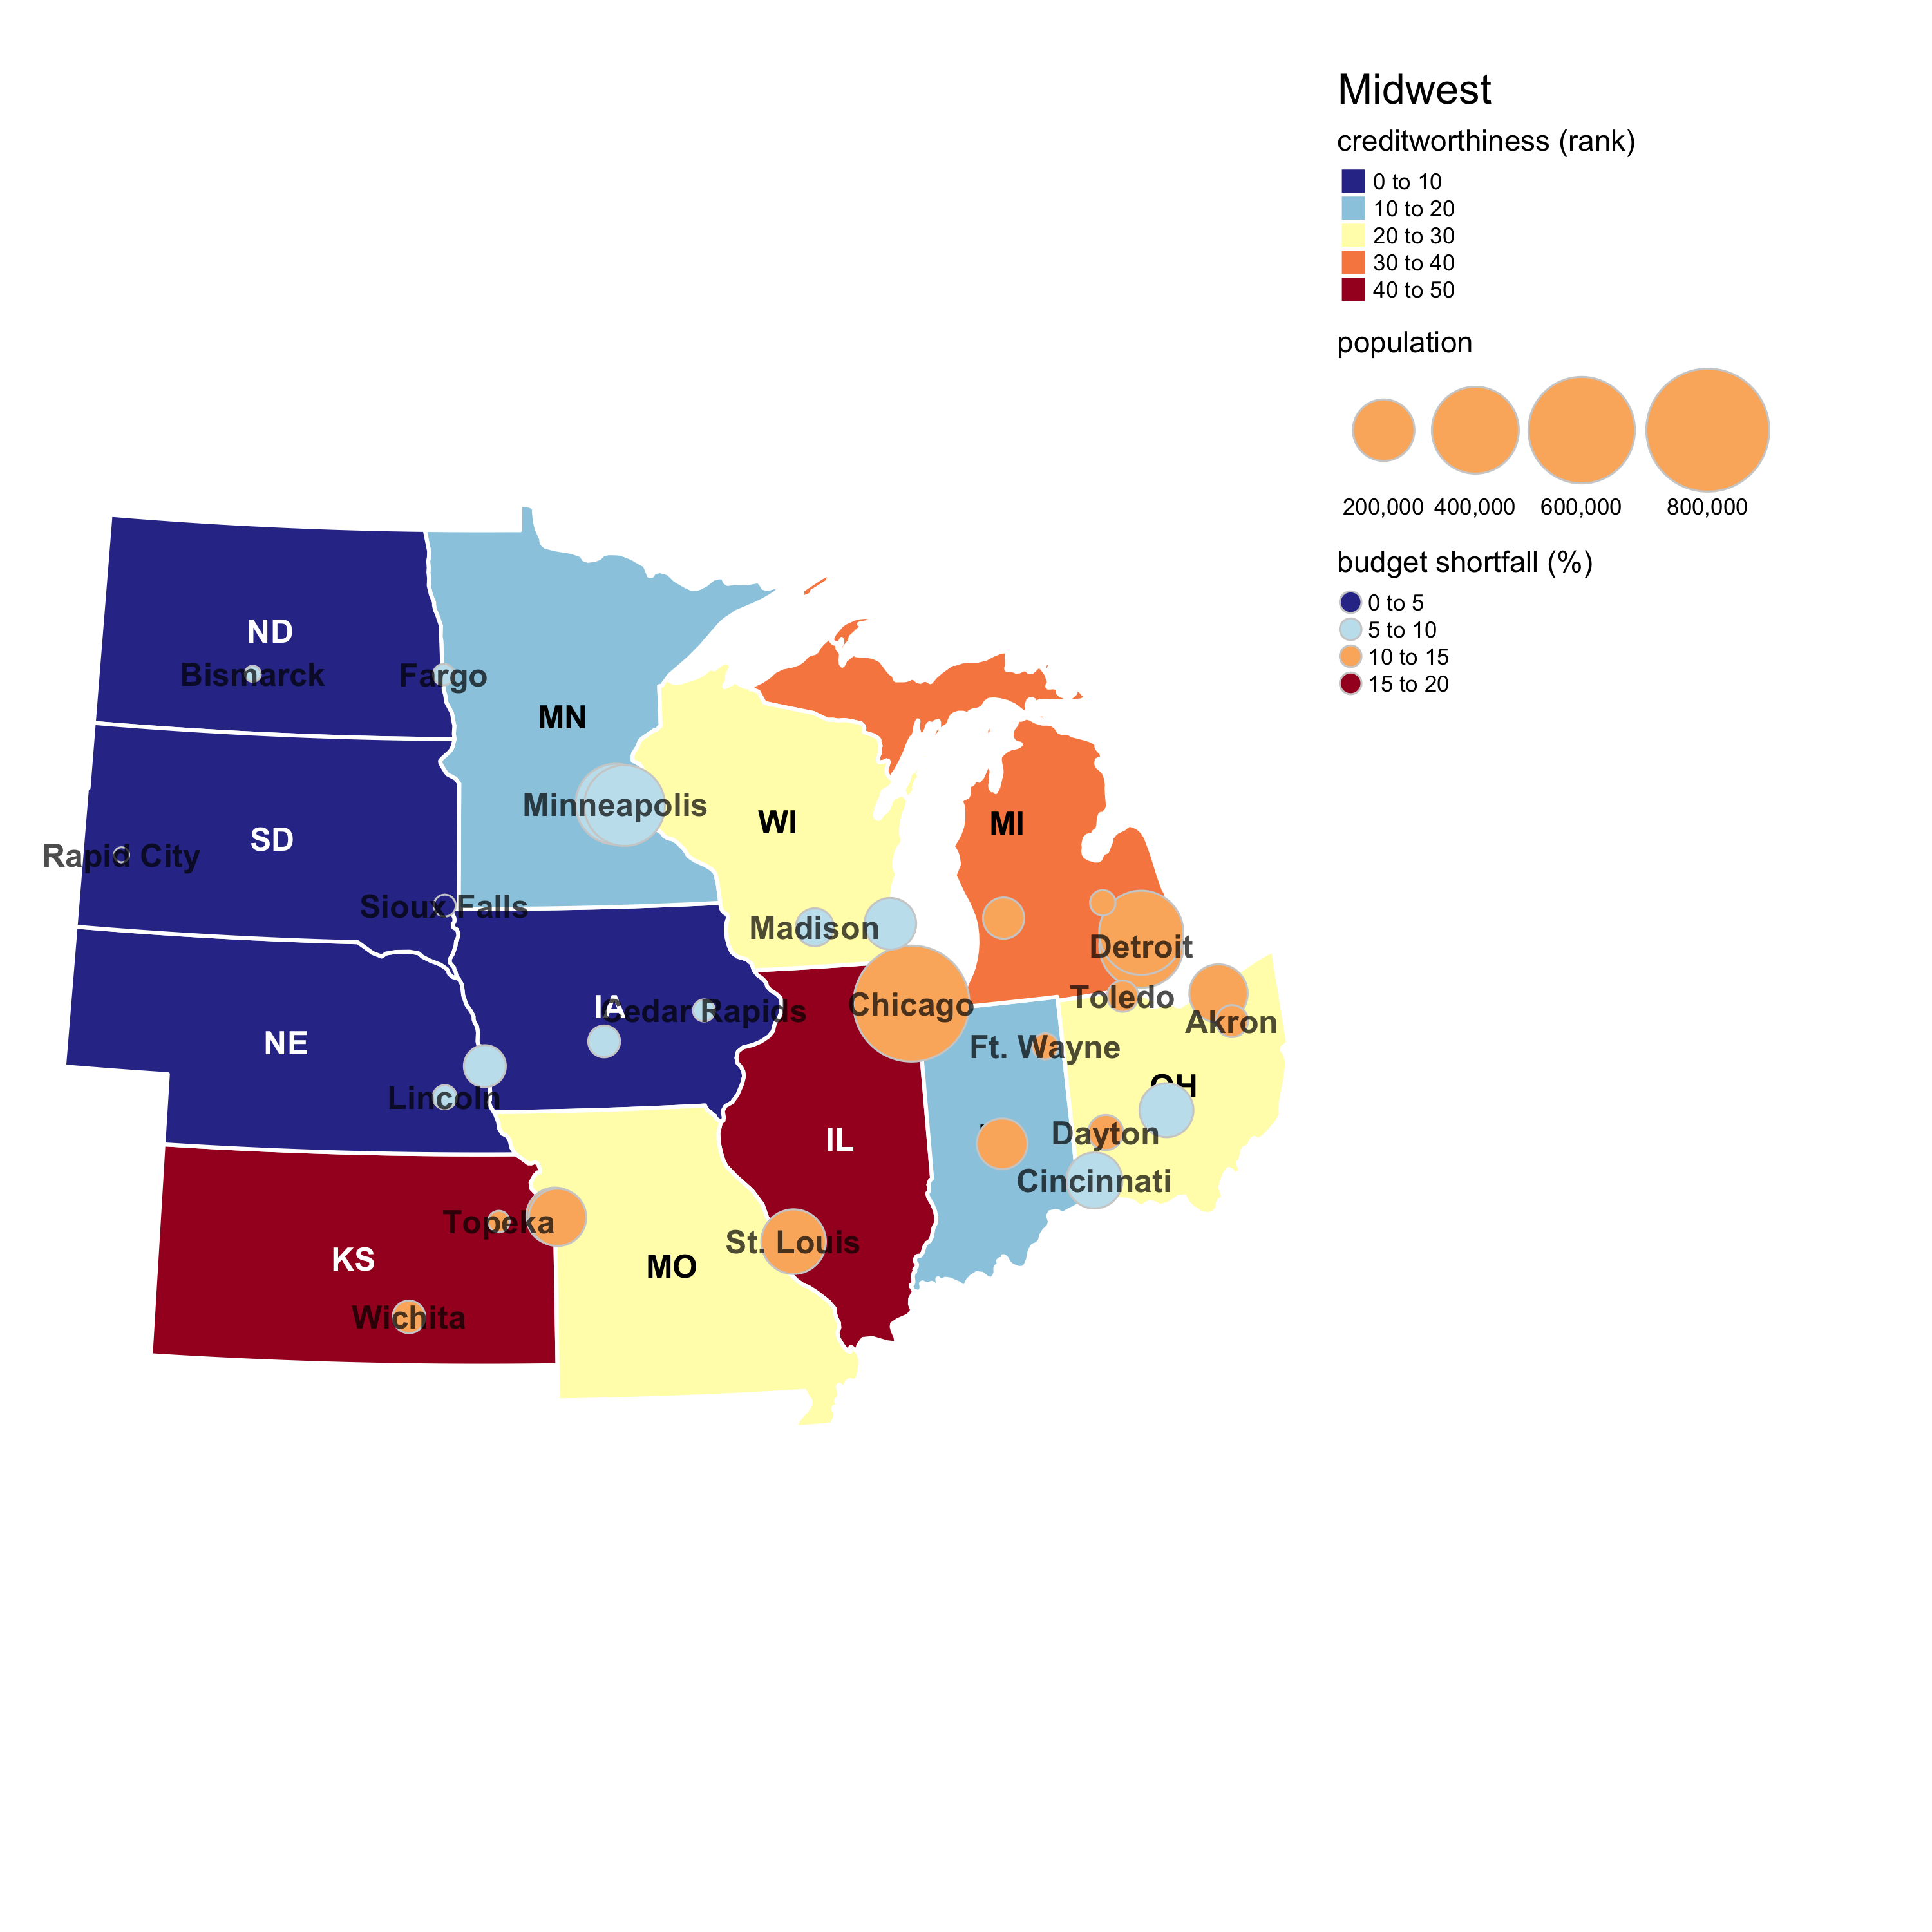
Where is COVID-19 hurting state and local budgets the most? To answer this question, Penn IUR and the Volcker Alliance have mapped data on state and local budgetary distress in the wake of COVID-19. State data from a recent article in Barron’s are based on Eaton Vance creditworthiness scores. Local data from a research paper by Howard Chernick, David Copeland, and Andrew Reschovsky identifies fiscal year 2021 projected local revenue shortfalls for 150 cities. Working with these combined datasets, Penn IUR—with the assistance of Penn Master of Spatial Analytics (MUSA) student Andrew Renninger—developed a map of the geography of fiscal distress in America. Also see regional maps for the West, South, Northeast, and Midwest. Andy Reshovsky, Professor Emeritus of Public Affairs and Applied Economics at the University of Wisconsin-Madison, presented the map at the Special Briefing on Fiscal and Operational Priorities for Cities in the COVID Crisis Era, held on September 10, 2020, available to stream here.
The data show that distress spans political lines, including red and blue states. For the most part, Rustbelt cities can expect large deficits, while Sunbelt municipalities will get by with comparably less disruption.
In an ongoing series of webinars, Penn IUR and the Volcker Alliance are convening academics, economists, and fiscal policy leaders to examine the severe fiscal challenges that the coronavirus pandemic is posing for U.S. states and municipalities. Keep an eye out for upcoming events and watch videos of earlier events by visiting the events section of the Penn IUR website.
The resources linked above on the pandemic’s implications for fiscal stability can be found in the Governance and Finance/ City and State Finance section of the Cities & COVID-19 Resource Library. Penn IUR regularly features a resource in the online library that we think is informative of current trends.
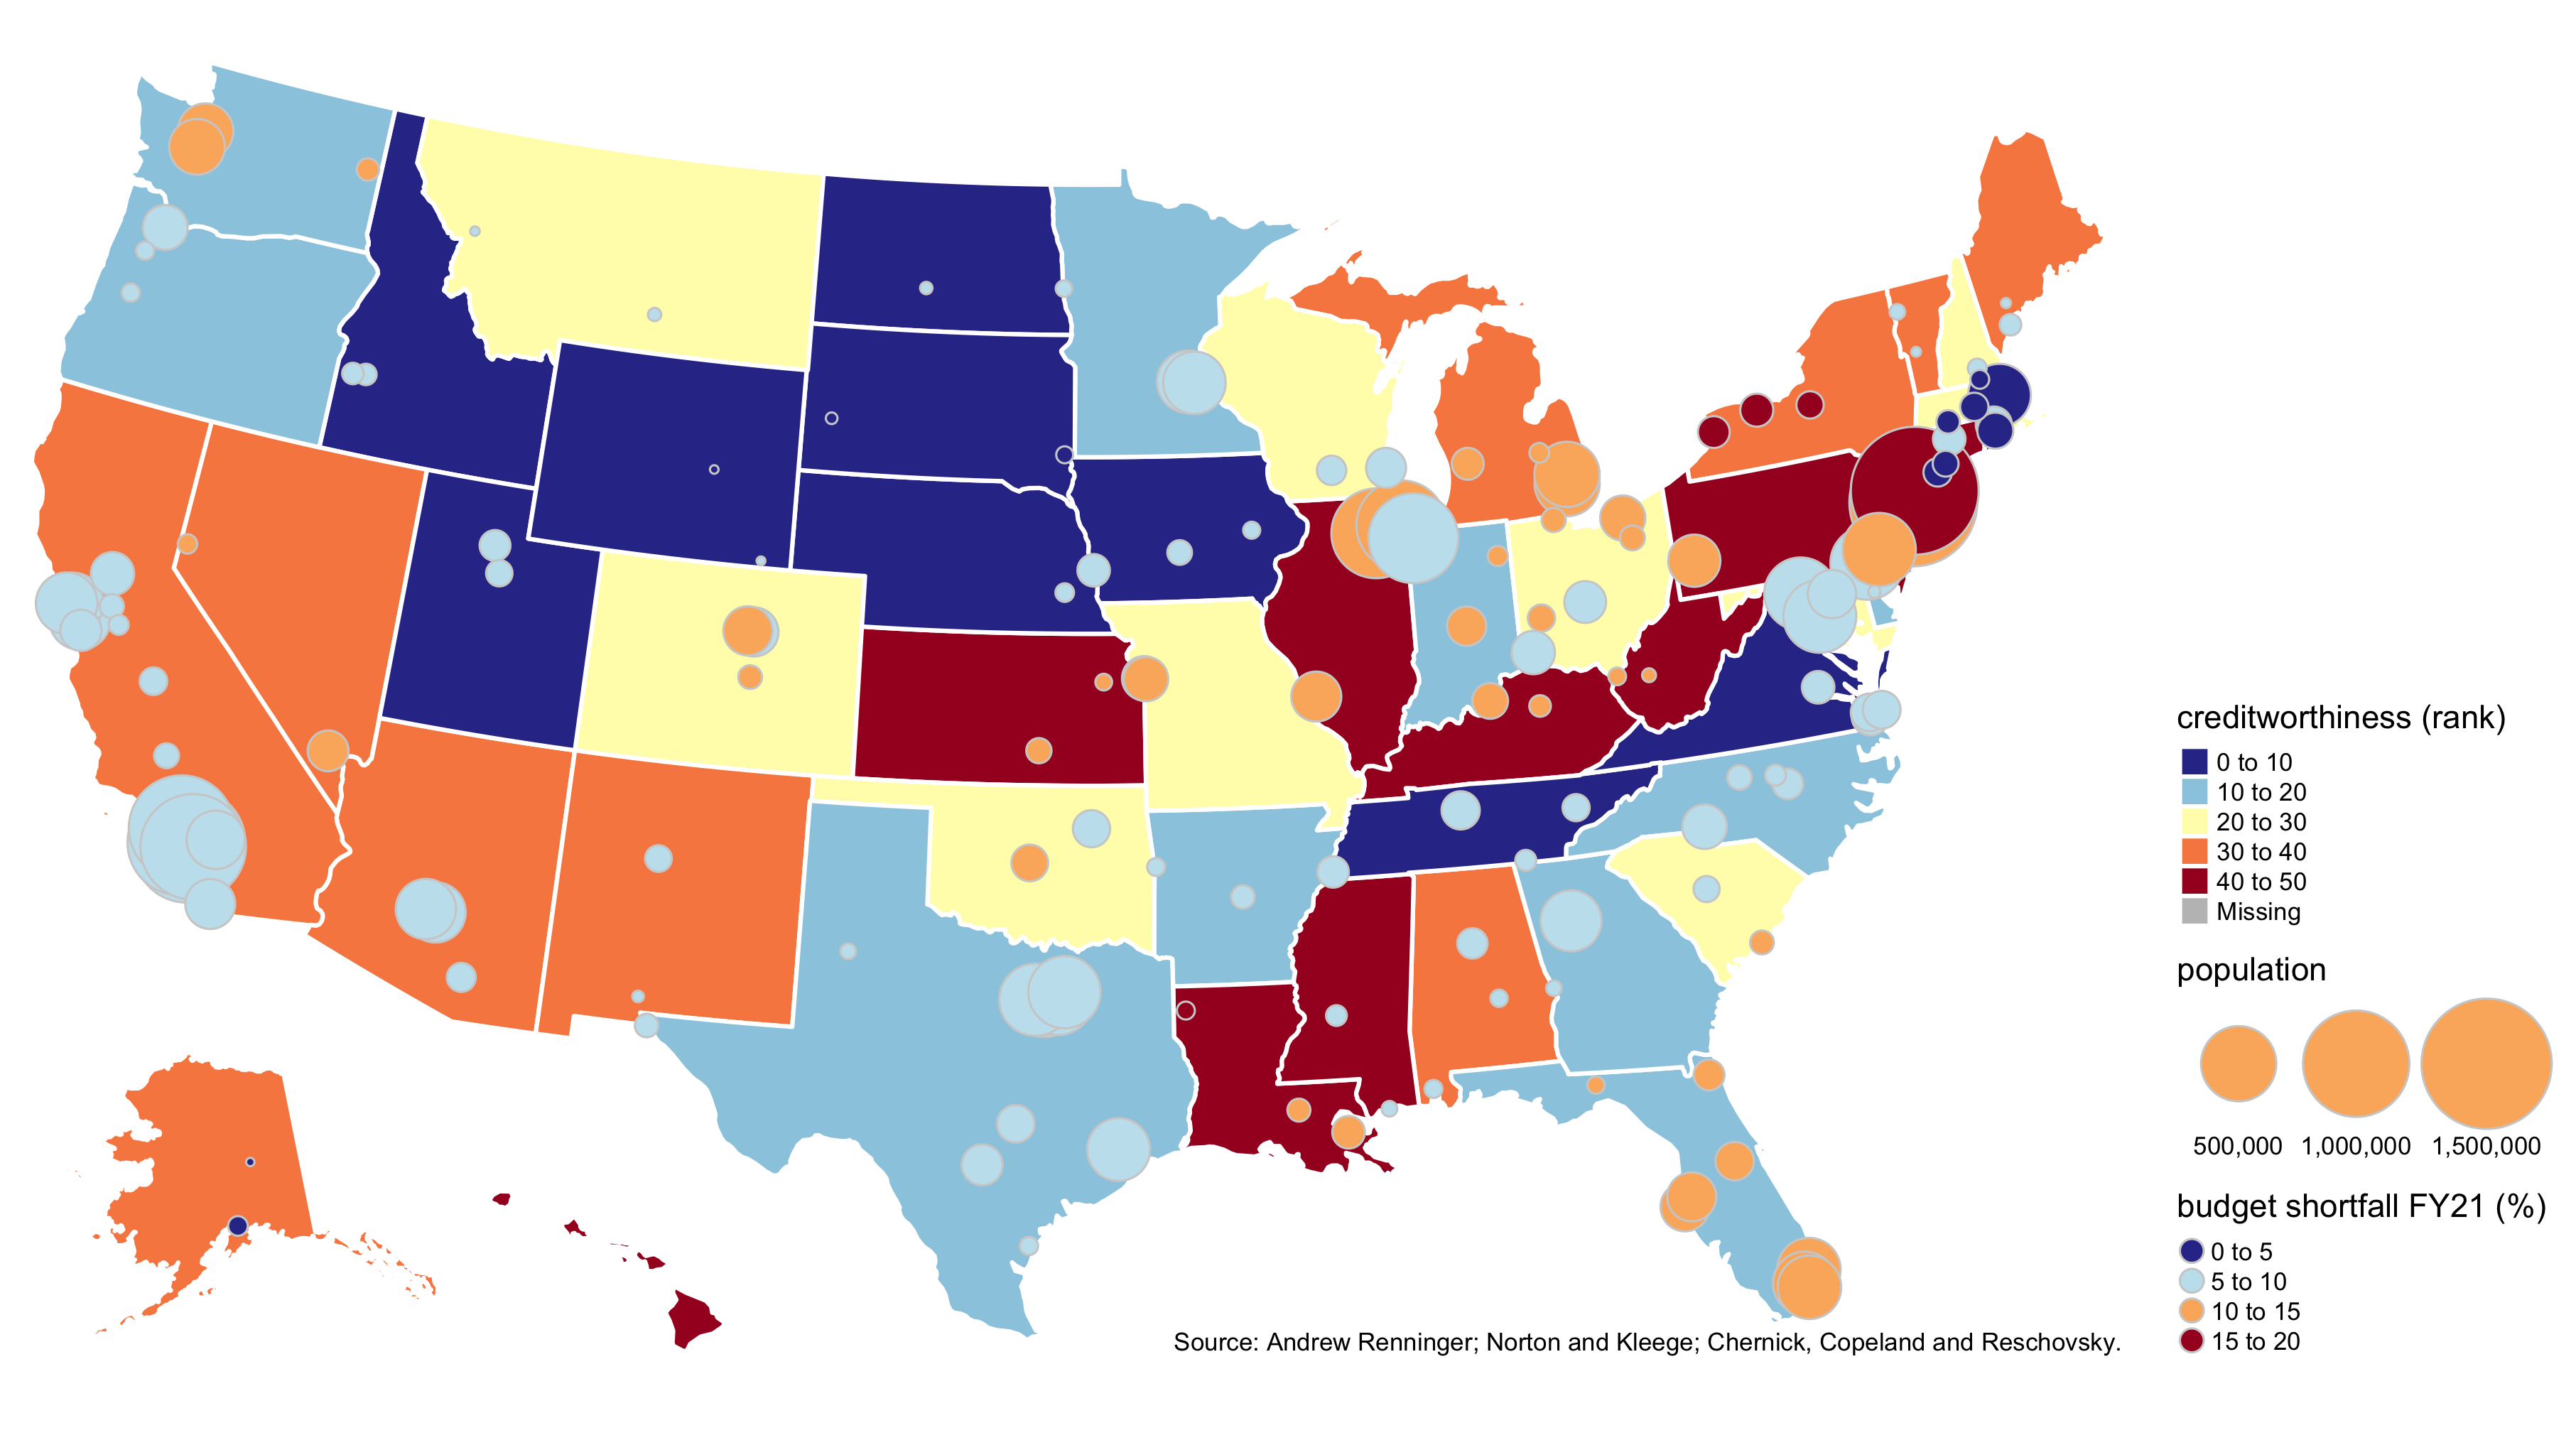
Credit: Andrew Renninger; Norton and Kleege; Chernick, Copeland, and Reschovsky
Providing expert commentary on urban topics and highlighting Penn IUR's research in the context of pressing urban issues.


