Article
Urban Link
Unemployment Still at Double Digits in Major Cities
December 16, 2020
The two figures below show trends in unemployment rates by metro and “city-counties” since the onset of COVID-19 compared to the Global Financial Crisis (GFC). Figure 1a shows that the 12 select city-counties have higher unemployment rates during the current recession than the national average and, while they are recovering, the average still is significantly higher than for the U.S. as a whole. It shows, too, that unemployment is higher than the national average for the ten largest metropolitan areas. The unemployment rate average for the 51 Large Metropolitan Areas (those with a 2010 Census population of 1 million or more), as well as for the largest 100 metropolitan areas, tracks that of the U.S. Figure 1b shows the nearly lockstep evolution of unemployment in the GFC.
Figure 2 (a and b) shows unemployment rates for the 12 city-counties. With the exception of Dallas, all show higher unemployment rates than that for the U.S. as a whole, with New York City, Los Angeles, and Philadelphia still at double-digit rates of unemployment. During the 2008 recession, unemployment rates in these urban areas were far closer to the national unemployment rate.
In November, the national unemployment rate fell from 6.9 percent to 6.7 percent according to the Bureau of Labor Statistic’s Employment Situation—November 2020. In the most recent data for the week ending December 5, the advance figure for seasonally adjusted initial unemployment claims was 853,000, an increase of 137,000 from the previous week's revised level. At the same time, labor force participation has continued to decline. There are about 10 million fewer jobs today than in February 2020, pre-COVID-19, as these graphs show, disproportionately in large urban areas and cities.
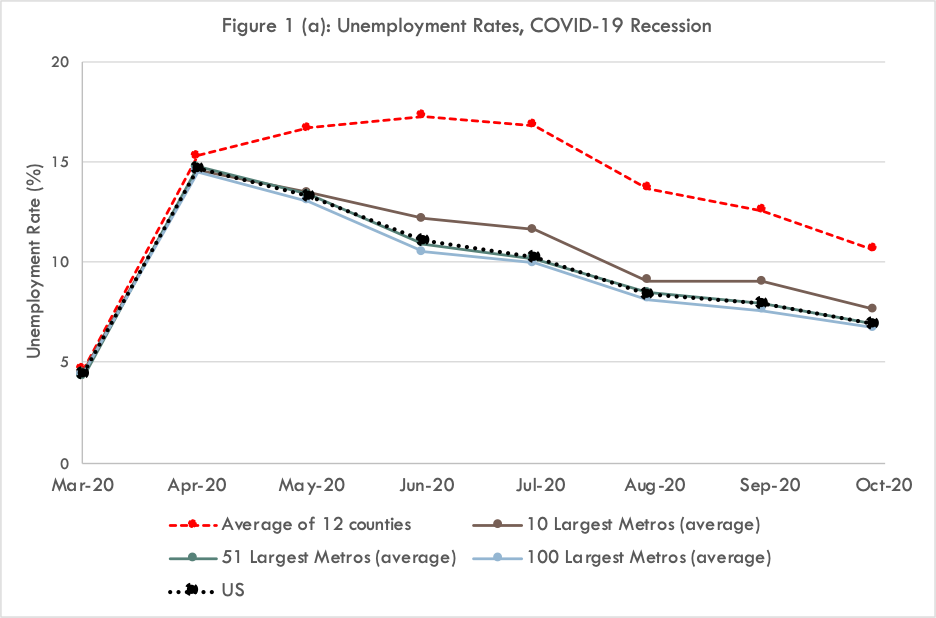
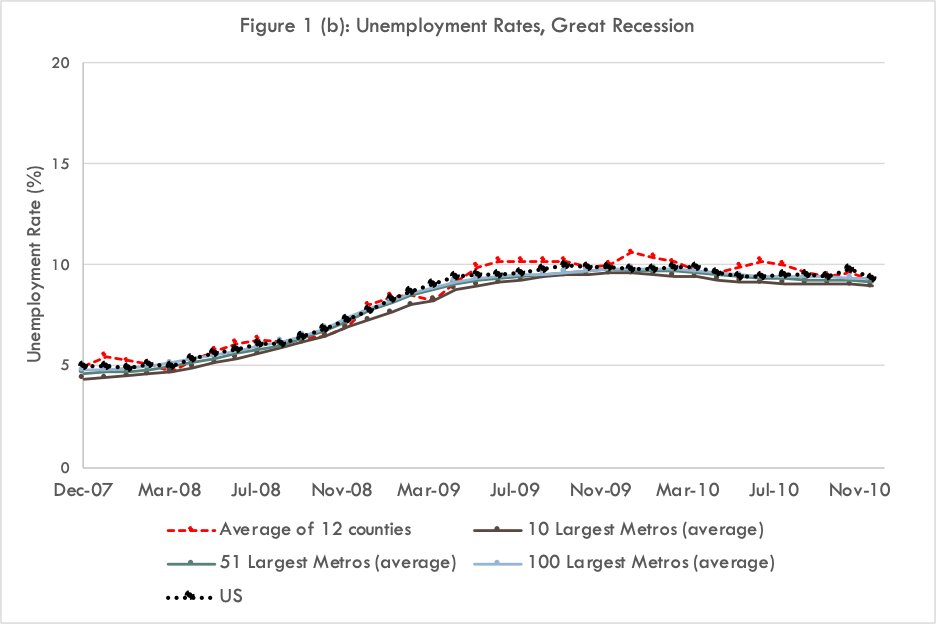
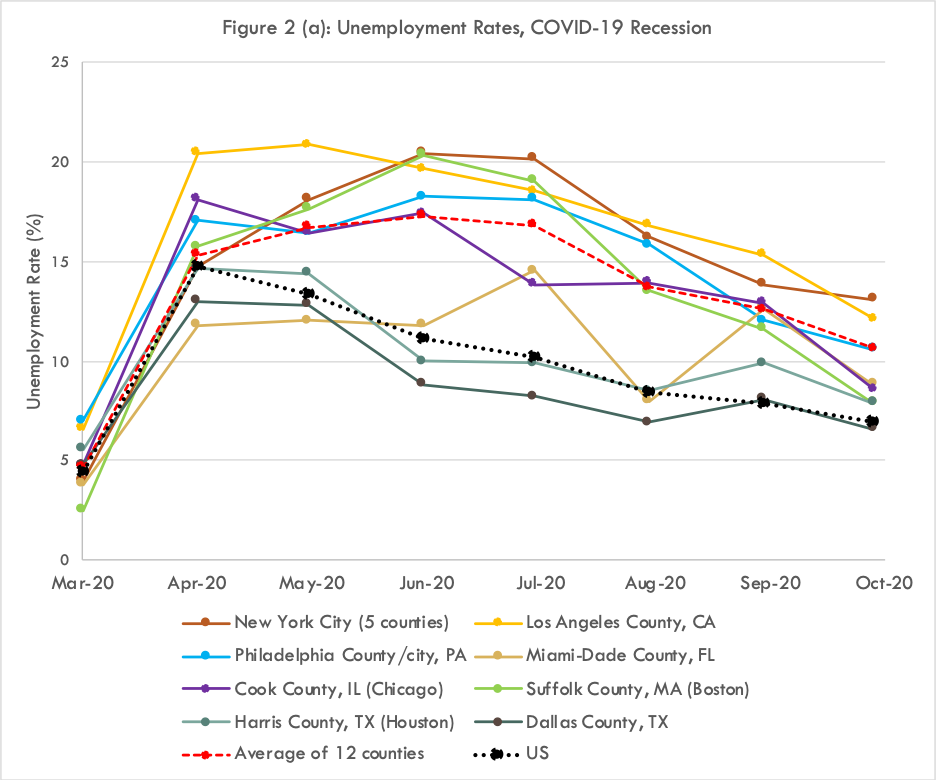

Source: Penn IUR, using data from the Bureau of Labor Statistics. National and metropolitan unemployment figures are seasonally adjusted. County unemployment figures are not seasonally adjusted.
Providing expert commentary on urban topics and highlighting Penn IUR's research in the context of pressing urban issues.