That the earth’s landscape is changing around us is no secret: urban areas are expanding, population densities are increasing, and green spaces are shrinking. In the midst of this transformation, urbanists, scientists, and policy makers are watching and weighing in, hoping that through better understanding of the dynamics of urbanization and sustainability, the earth can adapt, accommodate, and— yes—even thrive as the global population nears an anticipated nine billion or more in the next three decades.
The good news is that we now have tools to look squarely at changes in land cover and urban form, to see how they might be shifting the global maps describing the natural and manmade features that affect how people live. Some of the most promising tools are geospatial technologies, methods used to visualize, measure, and analyze earth’s features. The most well known are GPS (global positioning systems), GIS (geographical information systems), and RS (remote sensing).
With geospatial technologies, scientists can create maps that narrate the earth’s shifting landscapes through visual depictions that thoroughly describe the world around them. They can show political boundaries, buildings and streets, hydrology, the absorption of farmland and the settlement of land vulnerable to floods or other natural disasters. Joined with nuanced demographic analysis, climate-change patterns, or other public policy concerns, these data provide public and private decision-makers with benchmarks to gauge sustainability at various scales – neighborhood, city, region or nation. In fact, as this work becomes more widely distributed and employed worldwide, it will assist national and subnational statistical offices in serving as an important tool for a variety of analytical efforts ranging from monitoring the upcoming Sustainable Development Goals to be approved by the United Nations in September to grassroots advocacy for the inclusion of informal settlements in a municipality’s official map, a legal document that defines public and private space in a city.
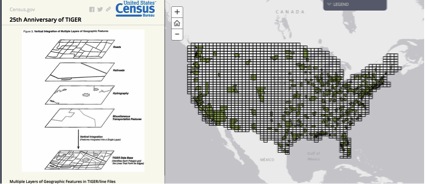
Perhaps the most widely used tool is GIS mapping, a technology that dates from the 1960s and has experienced major refinements over time. Many national and subnational statistical offices offer baseline GIS data and are geocoding demographic data to overlay on the maps. The US Census, for example, instituted its TIGER[1] mapping program twenty-five years ago with links to housing and population data as well other databases. See Figure 1 below.

Figure 1 An illustration of the layers of data incorporated into the US Census TIGER maps. (Source: US Census)
Remote sensing, also several decades old, is emerging as a newly important source for describing the urban world because advances in technology make it more accurate and ubiquitous. Improvements include the launching of satellites with higher recording capabilities – that is, more frequent and higher resolution images; the refinement of interpretation processes – that is better algorithms and machine-based treatment of the data; and more computing capacity – that is sufficient memory and power to handle the large amounts of data now being collected. Driving many of these advances are publicly sponsored open access programs. The US Landsat program is a prime example. Dating from the 1970s, it offers the world’s most robust, continuous record of satellite imagery. It has undergone many improvements. By 2013, the program had launched eight satellites (and is currently working on the ninth expected in 2023) with ever-stronger capacities as can be seen in its basic specifications. Today, Landsat 8 circles 438 miles above the earth and completes 14 orbits per day recording 115 mile wide swaths with each 99 minute orbit. It uses infrared sensors to yield 400 scenes daily and produces a full earth scan every 16 days. As Figure 2 illustrates, the Landsat dataset allows for multi-year comparisons.

Figure 2 Urban growth of Las Vegas between 1984 and 2013 (Source: US Geological Service http://pubs.usgs.gov/fs/2013/3060/pdf/fs2013-3060.pdf)
Many other entities are engaging in remote sensing projects, including the European Unions’ Joint Research Center, experimental work, the Global Human Settlements Layer, and the US National Aeronatics and Space Agency’s (NASA) night-lights maps.
Given the central role of geospatial technologies in understanding 21st century urbanization and sustainability, Penn IUR, together with the Master of Spatial Analytics (MUSA) program and the Wharton Initiative for Global Environmental Leadership (IGEL), recently sponsored a day of activities to share and explore the rapidly changing field. The events, scheduled to celebrate Earth Day, included an expert workshop on the role of geospatial technology in Sustainable Development Goals (SDGs) and a public panel entitled “Global Mapping and Remote Sensing for Sustainable Urbanization.”
What did our Earth Day experts say about geospatial technologies, sustainability and urbanization? Each had a different approach to the subject (see profiles below), but they resoundingly agreed on one thing: with the increasing sophistication of tools to map and analyze the earth, we can make smarter policy decisions for more sustainable and healthy growth.
Presentations on Geospatial Technology, Sustainability and Urbanization
Budhendra Bhaduri, Director, Urban Dynamics Institute, Oak Ridge National Laboratory, discussed LandScanHD, a new, high-resolution mapping-tool that can more precisely map population distribution, accurately extracting every building in California in less than five minutes. LandScanHD can “map people who have never been mapped before… who have never existed to you and me,” according to Bhaduri. The implications of monitoring the growth of such populations is to both improve their growth and development and also better calculate their vulnerability to the world’s changing climate. View Budhendra Bhaduri’s presentation.
Marc Imhoff, Visiting Research Scientist, Earth System Science Interdisciplinary Center, University of Maryland, spoke about sustainability as “urbanization increasing becomes the human enterprise.” Imhoff discussed the importance of understanding sustainability on both the macro (global) and micro level (city-specific transportation, agriculture, energy use). View Marc Imhoff’s presentation.
Mark Montgomery, Senior Associate, Population Council, described the capabilities of the database Desventar, a program created using geospatial technologies to record disaster records at a fine scale, using both remotely sensed and census data. “Spatial locations of disasters haven’t been specifically recorded in the past,” Montgomery said, and little to no information exists about small-scale disasters and their environmental, social, and economic impacts on countries. Such information could open up a whole new set of opportunities for emergency management and urban resilience. View Mark Montgomery’s presentation.
Martino Pesaresi, Scientific Officer, Global Security and Crisis Management Unit, Joint Research Centre, Institute for the Protection and Security of the Citizen (IPSC), demonstrated the abilities of the Global Human Settlements Layer (GHSL), a new technology that uses high and very high remotely sensed data inputs to map, monitor and analyze human settlements and urbanization. In Pasaresi’s words, GHSL is a tool for “systematic collection using satellite data [that] can create indicators for more effective measurement of human settlements.” View Martino Pesaresi’s presentation.
Christopher Small, Lamont Research Professor, Lamont-Doherty Earth Observatory, Columbia University, demonstrated their lab’s latest project that seeks to quantify the spatiotemporal changes of the earth’s surface. Understanding the consequences of land and settlement changes using satellite imagery can help inform future planning efforts and better prepare vulnerable populations for climate and development-induced environmental changes.
Richard Weller, Martin and Margy Meyerson Chair of Urbanism, Professor and Chair of Landscape Architecture, University of Pennsylvania, discussed the importance of preserving “representative and connected” open space throughout the world. He called for the need for a one stop shop, or ecological inventory, for the whole planet. View Richard Weller’s presentation.
Birch and Wachter are co-directors of Penn IUR. Birch is Lawrence C.Nussdorf Professor of Urban Research and Education Professor and Chair of the Graduate Group in City and Regional Planning. Wachter is Sussman Professor and Professor of Real Estate and Finance, The Wharton School.
[1] TIGER is an acronym for topographically integrated geographic encoding and referencing. The US Census and Geological Survey developed the format – maps incorporating land attributes (roads, buildings, water, political and administrative boundaries) that can serve as the base for overlaying demographic data. TIGER maps are open access.


