Research Paper
Megapolitan America Revisited: Demographic Trends to 2040
February 6, 2025
This report updates Nelson and Lang’s original analysis to provide demographic projections for all 23 megapolitan areas through 2040. This information, in turn, should be used by policymakers and planners to inform decisions about infrastructure investments, economic development opportunities, and housing demands
First published in 2011, Arthur C. Nelson and Robert E. Lang’s Megapolitan America provided an essential framework for understanding the role that large metropolitan areas have in driving the global economy, how the interconnectivity between these areas transcends governmental boundaries to create super economic regions, and what these areas’ economic agglomeration and population growth holds for the future.
The building blocks of megapolitan geography are census defined core-based statistical areas (CBSAs). Nelson and Lang combine these blocks to delineate how geography conditions the spatial flow of goods, workers, and services over much larger, contiguous geographic spaces than had previously been considered. These spaces are bound together by transportation infrastructure, shared physical environments that facilitate integrated planning, and common cultures and histories. Using these and other considerations, Nelson and Lang identified 23 megapolitan areas and 10 megapolitan clusters (adjacent megapolitan areas) in the lower 48 states.
Consistent with the framework’s goal of providing a new lens to understand large-scale economic mobility and connectivity, Megapolitan America eschewed labelling these areas in terms of their principal cities as is the case with CBSAs. Instead, Nelson and Lang designated megapolitan regions and clusters using monikers that were either already in use (e.g., “Texas Triangle”) or that they created such as the “Sun Corridor” for the Phoenix and Tucson megapolitan area to highlight the freshness of their approach and the scope of their endeavor. This report updates Nelson and Lang’s original analysis to provide demographic projections for all 23 megapolitan areas through 2040. This information, in turn, should be used by policymakers and planners to inform decisions about infrastructure investments, economic development opportunities, and housing demands.
Indeed, while the country’s current housing crises may have taken some policymakers by surprise, Megapolitan America reveals how predictable this crisis is based upon expected patterns of population growth and demographic diversification that Nelson and Lang detailed in 2011. Armed with updated information about America’s expected development patterns, hopefully urban planners and policymakers can avoid the mistakes of the past by updating their policy prescriptions to address these expected growth patterns. Most of the work on Megapolitan America was completed while Nelson and Lang were faculty members at Virginia Tech University’s Metropolitan Institute located on the Alexandria, Virginia, campus. Nelson would subsequently move to the University of Utah and then the University of Arizona before “retiring.” Lang came to UNLV in 2010 to lead Brookings Mountain West, a partnership between the university and the Brookings Institution that bring Brookings’ expertise to bear on issues facing the fast growing and rapidly urbanizing Mountain West, and The Lincy Institute, an applied public policy center that focuses on economic development, education, governance, health, social services, and nonprofits.
Since their inception, the megapolitan framework has been Brookings Mountain West and The Lincy Institute’s north star. We have used it to organize the State of Nevada’s economic development efforts (with big assists from Nelson after Lang’s passing); identify missing assets such as the lack of an interstate highway connection between Las Vegas and Phoenix or a facility to host large-scale events that led to Interstate 11 and Allegiant Stadium respectively; and to make the case for much needed investments in higher education and healthcare to facilitate economic diversification and better position Las Vegas to compete with neighboring megapolitan areas for talent and opportunities.
While we lost Lang much too soon, his work with Nelson is as prescient today, if not more so, than when it was published nearly a decade and a half ago. Carrying this work forward has been a highlight of my career and continues to provide opportunities to collaborate with Nelson on projects rooted in Megapolitan America.
Professor of Political Science and Lincy Presidential Chair
Executive Director, The Lincy Institute and Brookings Mountain West
UNLV
December 30, 2024
Megapolitan America was published in 2011 by Arthur C. Nelson and the late Robert E. Lang (2011). Their book challenged readers to envision a new way of looking at America’s emerging metropolitan geography in the contiguous forty-eight states. This Penn Institute for Urban Research report revisits their pioneering work in the context of demographic trends focusing on households and implications for housing policy.
The megapolitan construct is the latest of approaches describing America’s evolution into a system of large-scale, trans-metropolitan urban regions. The evolution in thinking started a century ago. In 1932, the New Republic published an exchange between the eminent urban scholar Lewis Mumford and Thomas Adams, then director of the Region Plan of New York and Environs (now the Regional Plan Association, or RPA). The exchange contrasted what Fishman (2000) calls “regionalists” (led by Mumford) and “metropolitanists” (led by Adams).
Metropolitanists assumed that 20th century cities would continue in their 19th century form even as they grew to tens of millions of people and extended 50 or more miles from the center (Thomas 2000). Public investment would be directed to the metropolitan core while also facilitating its incremental outward expansion, much like Burgess’ and Park’s (1925) concentric ring theory of urban ecology. In contrast, Regionalists saw the rise of polycentric metropolitan structure that reduced the dominance of the central business district in favor of a dispersed network of nodes and places across a vast, although integrated, “urban region” (Fishman 2000).
The year after the Mumford-Adams debate, urban sociologist R.D. McKenzie (1933) published The Metropolitan Community which formalized the regionalist perspective. McKenzie argued that American metropolitan development:
“...is tending to concentrate more and more in large regional aggregates. In every such aggregate, the population tends to subdivide and become multinucleated in a complex of centers that are economically integrated into a larger unity (p. 1).”
Three decades later, Jean Gottmann’s Megalopolis (1961) “effectively completed the analysis of metropolitan regionalism undertaken by R.D. McKenzie three decades earlier” (Thomas 2000: 50). Like McKenzie, Gottmann emphasized economic integration across a vast, multi-metropolitan landscape which in the case of Megalopolis extended from southern Maine to somewhat south of Washington, DC (see figure 1).
The megalopolis concept has had little lasting impact outside academic geography (Baigent 2004: 687). But that is changing. Entire regions comprised of multiple metropolitan areas are becoming known as much for their megalopolis-type name such as the Dallas-Fort Worth “Metroplex”, the “Front Range” anchored by Denver, the “Wasatch Front” anchored by Salt Lake City, the San Francisco “Bay Area,” and “Southern California” which is centered on Los Angeles but including million-plus metropolitan areas to the east and south along with numerous smaller metropolitan areas to the north. Indeed, this writer has known of businesspeople conflating Atlanta with all of the state of Georgia, or Miami with all of Florida’s southeast coast, which is comprised of multiple million person-plus metropolitan areas. This writer is also pleased that the “Sun Corridor” economic development agency serving Arizona from Sedona to Nogales incorporated its name after Megapolitan America was published.
This report uses the megapolitan construct to project demographic trends for each megapolitan area to 2040, focusing on overall population trends, households and housing policy implications. It is comprised of the following sections:
I “America’s megapolitan geography” summarizes the evaluative process used to craft megapolitan areas. Unlike ad hoc attempts to create constructs of metropolitan regions, including Gottmann’s megalopolis, the megapolitan geography is based on statistical analysis. It concludes with a perspective that confronts popular misconceptions of America as a sprawling, very low-density landscape in contrast to Europe’s dense urban areas. Readers may be surprised.
II “Megapolitan population trends” provides a snapshot of how America generally and its megapolitan areas particularly are changing with respect to total population and white/non-white population changes. That America is becoming more non-white is well-known, but there are important differences in trends among megapolitan areas compared to the nation.
III “Megapolitan household trends” presents detailed comparisons of household change between 1980 and 2010, and between 2010 and 2040 for the nation and each megapolitan area.
IV “Implications for housing policy” concludes this report with an assessment of challenges to meet housing needs in America’s megapolitan areas. The challenges vary considerably between stagnating and robust megapolitan areas but sometimes in ways that are surprising.
An overview of America’s megapolitan geography is presented next.
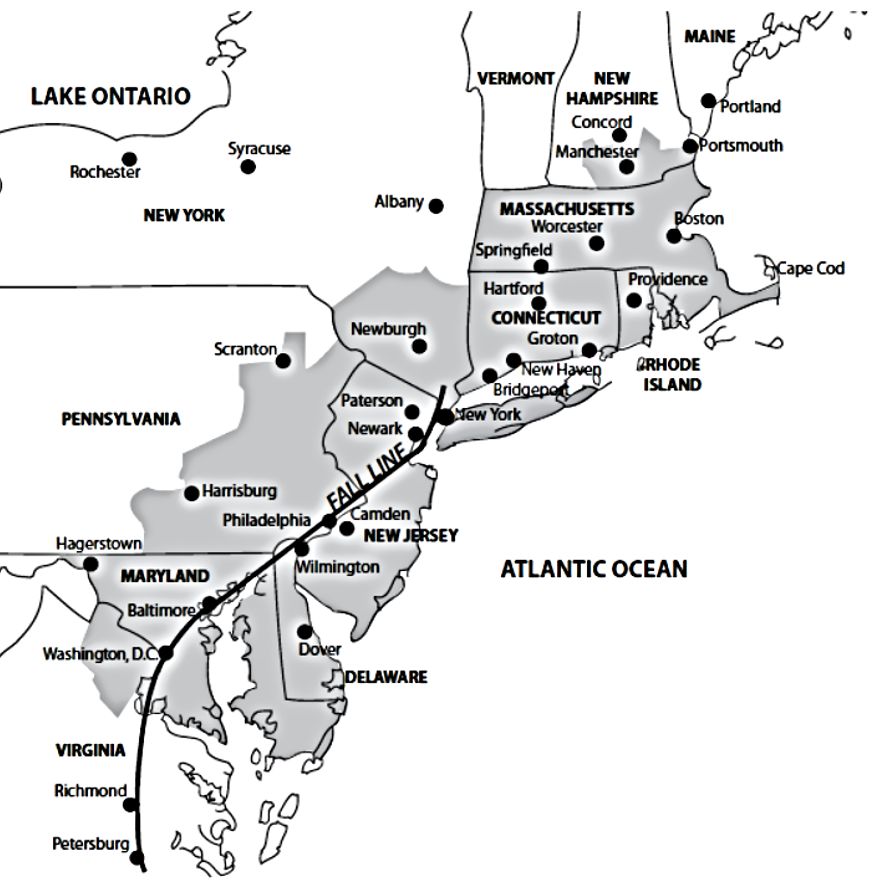
Figure 1: Jean Gottmann’s megalopolis geography. Source: Image by Doug Woodruff adapted from Gottmann (1961).
While Gottman’s megalopolis construct focuses on only the northeast, several large-scale constructs have been advanced since. Two offer socio-cultural-political perspectives that apply to North America: Joel Garreau’s “Nine Nations of North America” (1981) and Colin Woodard’s “Eleven nations of North America” (2011). The “megaregion” construct developed over the past quarter century by a number of scholars will follow. The megapolitan construct will be presented in the next part.
Garreau’s Nine Nations of North America (1981) (Figure 2) assigned all the space on the continent to one of nine regions sharing historical, social, cultural, and economic affinities. He argues that local, state and national borders are irrelevant, and that viewing each region as its own nation advances understanding of how North American society functions. The boundaries of the nine nations are arbitrary, however, based mostly on Garreau’s intuition.

Figure 2 Garreau’s (1981) Nine Nations of North America. Source: Wikipedia.
Colin Woodard’s eleven nations of North America is a cultural anthropologist’s perspective on how North American is divided into discrete, like-minded landscapes (see Figure 3) While covering most of North America, as Garreau’s nine nations do, Woodard’s construct assigns each county to one of 11 nations, based on historical and cultural factors. Indeed, he argues that one may move from one nation to another and over time adapt cultural (and political) perspectives of their adopted nation or at least manage perspectives that clash with their own.

Figure 3 Woodard’s Eleven Nations of North America. Source: Woodard (2011).
The contemporary megaregion construct has its origins with Armando Carbonell’s and Robert Yaro’s article “American Spatial Development and the New Megalopolis” (2005). Their work is borrowed from the spatial development policies of the European Union (see Faludi 2002). Carbonell’s and Yaro’s megaregion construct was initially explored during a University of Pennsylvania planning studio taught in 2005 by Armando Carbonell of the Lincoln Institute of Land Policy and Robert Yaro of the (New York) Regional Plan Association. In 2006, those two organizations convened the National Committee for America 2050—a coalition of planners and civic leaders—to develop a national framework for America’s rapid population growth and the emergence of what they call megaregions. Conceptually, megaregions are combinations of metropolitan areas that merge into each other. Not only do they include multiple cities and counties, but many also include whole states. The original 2005 construct included 11 megaregions (Figure 4). Catherine Ross’s (2009) edited volume, Megaregions: Planning for Global Competitiveness, synthesized this “school of thought”. Although the design of megaregions were guided by such measures as location in a core based statistical area, minimum population density, projected population and employment growth rates, projected increases in population density, in the end the actual allocations of counties to particular megaregions was left to professional judgment. The megaregion boundaries were refined in 2009, but the number of megaregions fell to 10 (Figure 5) (US Department of Transportation. 2017). However, Ross et al. (2023) increased the number of megaregions to 13 (Ross et al, 2023) (Figure 6). Yaro, Zhang, and Steiner (2022) use the 2009 megaregion construct to argue for policy to recognize that America in the 21st century will depend on the vitality of its megaregions.
Internationally, the megaregion construct is used to describe the global phenomenon of urban and metropolitan areas merging into each other (Faludi 2002, Mukhopadhyay 2016). In effect, each megaregion is in competition with other megaregions. Indeed, national policy would be directed to making their megaregions more competitive in the global economy. It is worth noting that Glocker (2018) created an algorithm comprised that was applied internationally. It derived 17 North American megaregions that included those in Canada, Mexico, and the U.S.
There are also two efforts that apply the megaregion construct to China. Yang, Song, and Lin (2012) identified 10 megaregions in China. More recently, Hu (2024) creates two classes of megaregions that are called “city clusters” that are applied to the Beijing-Tianjin-Hebei, Yangtze River delta, and Greater Bay Area regions, and “metropolitan circles” that are applied to the Chengdu, Hangzhou, Hong Kong, Shanghai, Shenzhen, and Zhengzhou regions, for a total of 9 megaregions.

Figure 4 Megaregions After Carbonnel and Yaro (2005). Source: http://www.america2050.org/sync/elements/america2050map_lo.png

Figure 5 Megaregions After Ross (2009). Source: Ross 2009.

Figure 6 Megaregions After ross (2023). Source: Ross et al. 2023.
The perspective of Nelson and Lang is that such constructs as the nine or 11 nations are much too large spatially to properly characterize America’s emerging economic geography. But those constructs were not designed to address anything but spatial differences in social, cultural and political affinities. Likewise, the megaregion constructs of 10, 11 or 13, is also too large and imprecise to grasp for policy and regional planning purposes, which is the ultimate limitation of Gottmann’s megalopolis.
That America’s urban areas are linked to each, often creating systems of metropolitan areas functioning as their own economic engines, has long been accepted. That they are growing in importance to the nation’s long-term economic health is accepted generally. What is missing is a clear, predictable method to define the unique combinations of places and spaces to guide the next generation of planning and policymaking at a manageable scale. The megapolitan construct may facilitate this. It is described next.
It was not Nelson and Lang who first coined the term “megapolitan” but Gottmann himself:
"...the Megapolitan concept seems to have popularized the idea that the modern cities are better reviewed not in isolation, as centers of a restricted area only, but rather as parts of “city-systems,” as participants in urban networks revolving in widening orbits."
Jean Gottmann (1987, p. 52)
Beyond this mention, however, it was not until Lang and Dhavale (2005) and Nelson and Lang (2011) that the concept became formalized, two decades later.
The megapolitan construct is based on a web of economic exchanges and social interactions. On the economic side, urban economies are successful if they:
As the geography of economic exchange increases, so does the size of metropolitan areas. Over time, metropolitan areas and their proximate landscapes merge, creating larger economic units. This is illustrated in Figure 7.
Arthur O’Sullivan (2019) posits a fourth dimension that is uniquely 21st century: high-quality social interaction. He suggests that not only have place-centric models run their course, but so have deconcentration models (i.e. urban sprawl). The new urban economy is homocentric in that because of technology, flexible working conditions, and so forth, people have unprecedented residential location options—because they are the centers of their own microeconomy. While this may argue for continued deconcentration into the exurbs and rural landscapes, in a homocentric economy, people depend and even thrive on social interactions that cannot be done on the internet or “zoom” as efficiently as in person. In a peculiar twist, the ability to live anywhere may lead more people toward places and not away from them, even after the COVID-19 pandemic (Florida 2023).
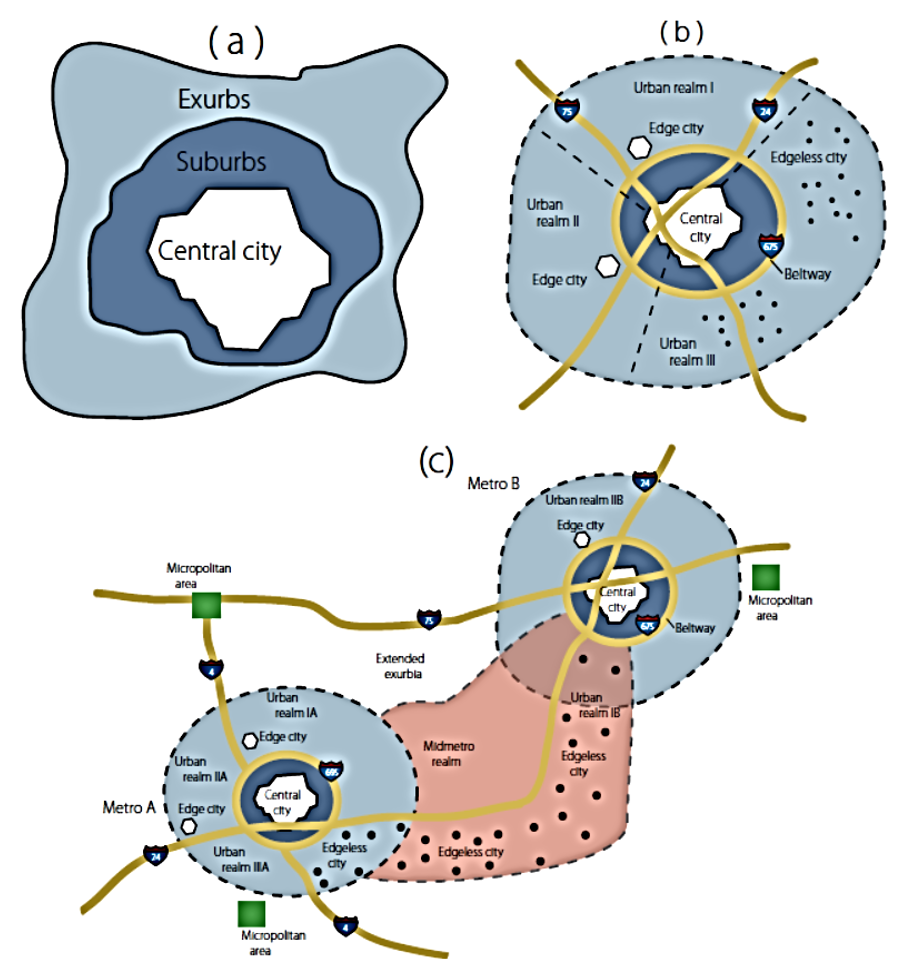
Figure 7: Conceptual Merging of Multiple Metropolitan and Micropolitan Areas, and Nearby Nonmetropolitan Areas, into Megapolitan Areas. The development and evolution of American metropolitan areas can follow a predictable path: (a) The urban form starts as organized tightly around a dominant central business district and transportation hub; (b) growth and improvements in transportation allow for highways serving automobiles, and since about 1950, urban areas have evolved into dispersed, polycentric forms, accompanied by the rise of urban realms; and (c) metropolitan areas merge over time into essentially one megapolitan unit. Source: Robert E. Lang
Until Nelson and Lang, and aside from the Census Bureau’s method for defining metropolitan geographies in numerous ways, no metropolitan regional construct was based on a scientific method. To correct for this, Dwayne Guthrie, then a doctoral student, devised a net worker exchange model, illustrated in Figure 8 to identify the geographic extent of commuter sheds.1 Guthrie created a worker flow index for each county in the continental United States. The index accounts for the share of workers flowing in and out of the county, as well as the absolute number of workers coming and going. An index score of 15 percent was used as the threshold for assigning counties to the nearest metropolitan area essentially through a daisy chain process.
This objective analysis is subject to a filtering step. In addition to meeting the objective net worker exchange flow criterion, a megapolitan area as defined further has having following characteristics:
This protocol formed the basis for creating 23 megapolitan areas for the contiguous states. The final result is illustrated on the cover of this report. Table 2 lists the 23 megapolitan areas including their assembly into cluster based on geographic affinities.
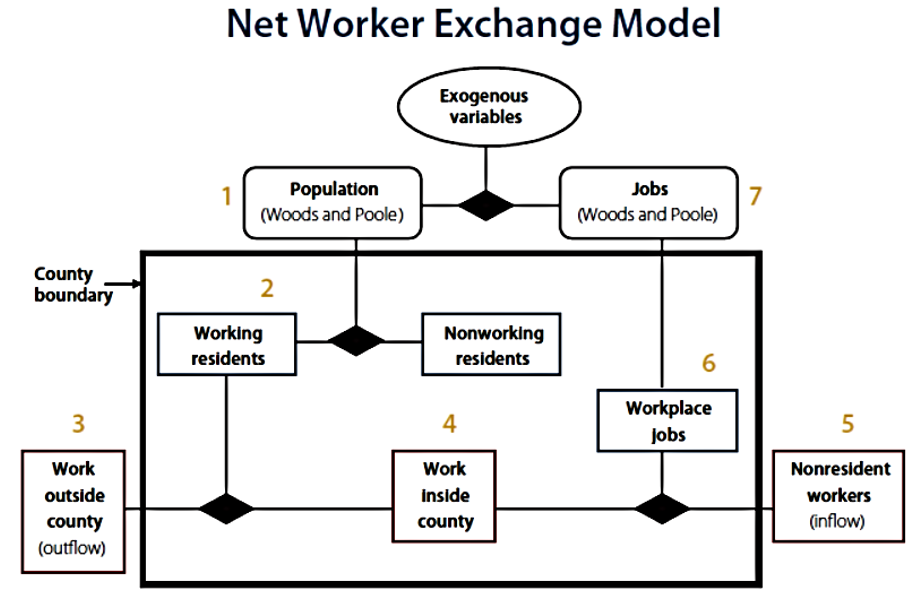
Figure 8: Net Worker Exchange Model. Source: Dwayne Guthrie in Nelson and Lang (2011).
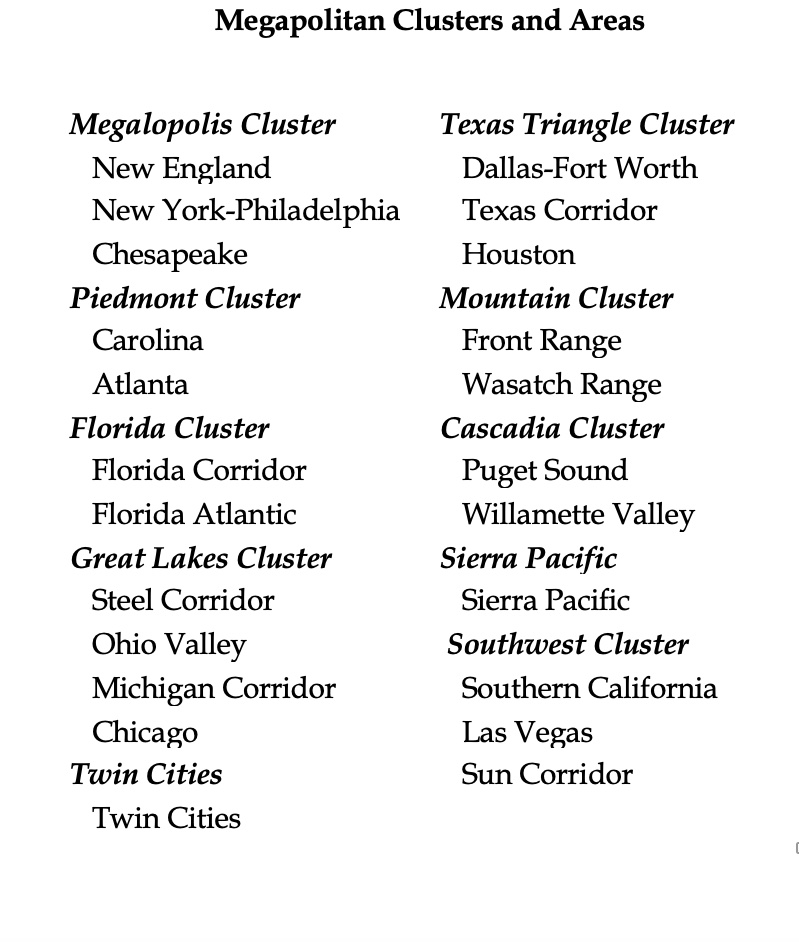
Table 1: List of Megapolitan Areas by Cluster. Source: Dwayne Guthrie in Nelson and Lang (2011).

Figure 9: Megapolitan America. Source: Nelson and Lang (2011)
The megapolitan construct provides an important perspective in which to frame America’s regional development patterns. Consider that as early as the 1880s, geographers and demographers assumed there were two Americas with one as densely settled as Europe and another an open frontier. Henry Gannett, the census’s original geographer, argued that only the developed parts of the U.S. should be used in determining infrastructure demand and type, and for urban comparisons with Western Europe. He disdained those who failed to recognize this:
"I was asked not long ago, by a foreigner. 'What is the density of settlement in your country?' to which I was obliged the true Yankee rejoinder, “What portion of my country?” The average density of settlement of such a country as this some parts of which are peopled as fully as the oldest parts of Europe, while great stretches, empires in extent are as yet almost without inhabitants, means nothing, and the question of my friend implied an ignorance." (Gannett 1882: 70).
More than a century later, he might have focused his disdain on Paul Samuelson (2009), who famously derided America’s efforts to create high-speed rail service:
"What works in Europe and Asia won’t in the United States. Even abroad, passenger trains are subsidized. But the subsidies are more justifiable because geography and energy policies differ.
Densities are much higher, and high densities favor rail with direct connections between heavily populated city centers and business districts. In Japan, density is 880 people per square mile; it’s 653 in Britain, 611 in Germany and 259 in France. By contrast, plentiful land in the United States has led to suburbanized homes, offices and factories. Density is 86 people per square mile. Trains can’t pick up most people where they live and work and take them to where they want to go. Cars can."
Au contraire.
In Megapolitan America, Nelson and Lang wrote:
"In a space as large as France and the Low Countries, the Netherlands and Belgium—considered some of the world’s most densely settled regions—America’s “megapolitan” areas house more than 2.5 times as many people. In fact, although they occupy only 17 percent of the contiguous 48 states’ land base, America’s megapolitan areas are more densely settled than Europe as a whole. Or the United Kingdom. Or Japan. Or India." (Nelson and Lang 2011: xxiv)
America’s megapolitan areas are in fact quite dense, though their land use patterns may not be conducive to European-style urban forms and transit systems, yet.
This part takes a broad view of megapolitan population trends compared to the nation over the periods 2000 and 2020, and 2020 to 2040. Figures for 2000 and 2020 come from the US census while figures for 2040 come from Woods & Poole Economics, which is the only firm that reports county-level demographic projections to 2060, though 2040 is used in this report. Projections are reported for the total population as well as White non-Hispanic (White) and all other persons (non-White).
Table 2 reports figures for all three populations for the two periods, for all megapolitan areas and the rest of the nation (including Alaska and Hawaii). It also reports shares of population and population change for all three groups. Summaries are offered with respect to overall trends followed by each of the megapolitan regions. The regional summaries include detailed images of them.
Trends are considered first for the total population and then for Whites and non-Whites.
Between 2000 and 2020, Megapolitan areas added 36.6 million people compared to the rest of the nation at 13.7 million, accounting for about 73 percent of the nation’s growth. Given that only 62 percent of the nation’s population lived in megapolitan areas in 2000, their share of the nation’s growth is remarkable. Between 2020 and 2040, megapolitan areas are projected to account for 71 percent of the nation’s growth. Between2000 and 2040, megapolitan areas are projected to increase from 62 percent to 65 percent of the nation’s population. While this does not appear to be a large number, it reflects a shift of about 5.7 million in the proportion of people into megapolitan areas, or about the number of people living in Colorado in 2020.
Between 2000 and 2020, megapolitan areas accounted for 38 percent of the increase in the White population compared to 62 percent for the rest of the nation. Clearly, non-megapolitan areas dominated White population growth. However, between 2020 and 2040, the entire nation will see a reduction in the White Population with megapolitan areas accounting for 95 percent of the loss.
The change in the non-White population is projected to roughly mimic overall national population trends. During the period 2000 to 2020, megapolitan areas accounted for 76 percent of the nation’s growth among the nonWhite population while during the period 2020 tom 2040 they are projected to account for about 75 percent of the change.
Population trends in individual megapolitan regions and areas are shown and described in figures 4 through 13 below. (Note that the population figures reported in the text are to the nearest 100,000 when geography includes more than one million people, but to the nearest 10,000 when geography includes less than one million people.)
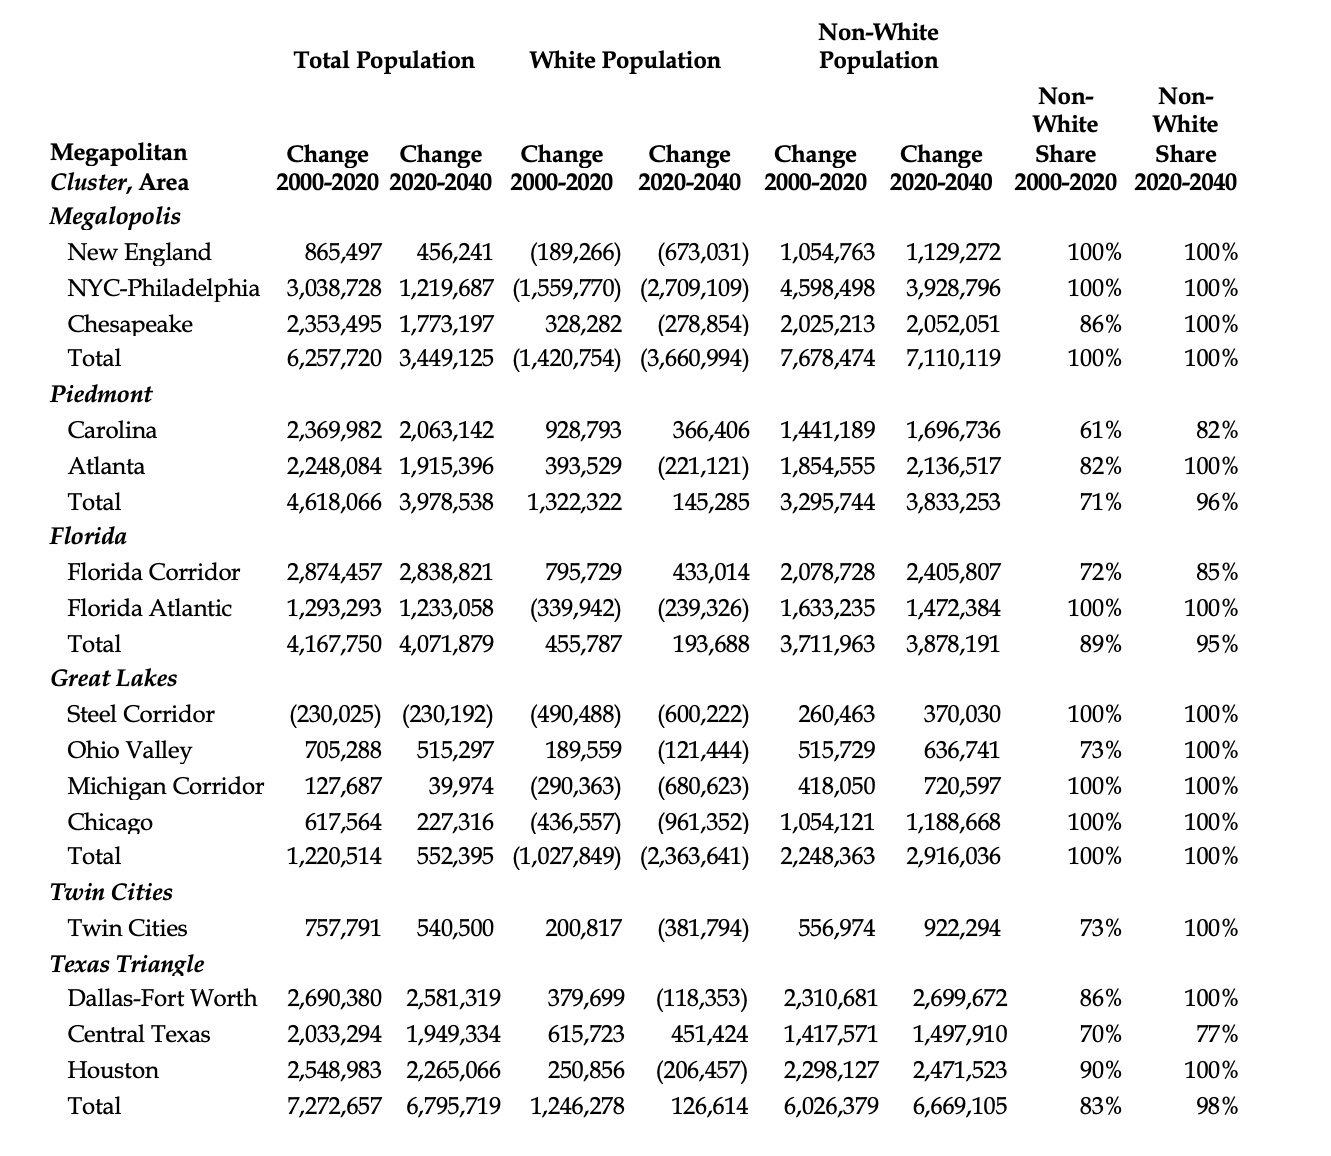
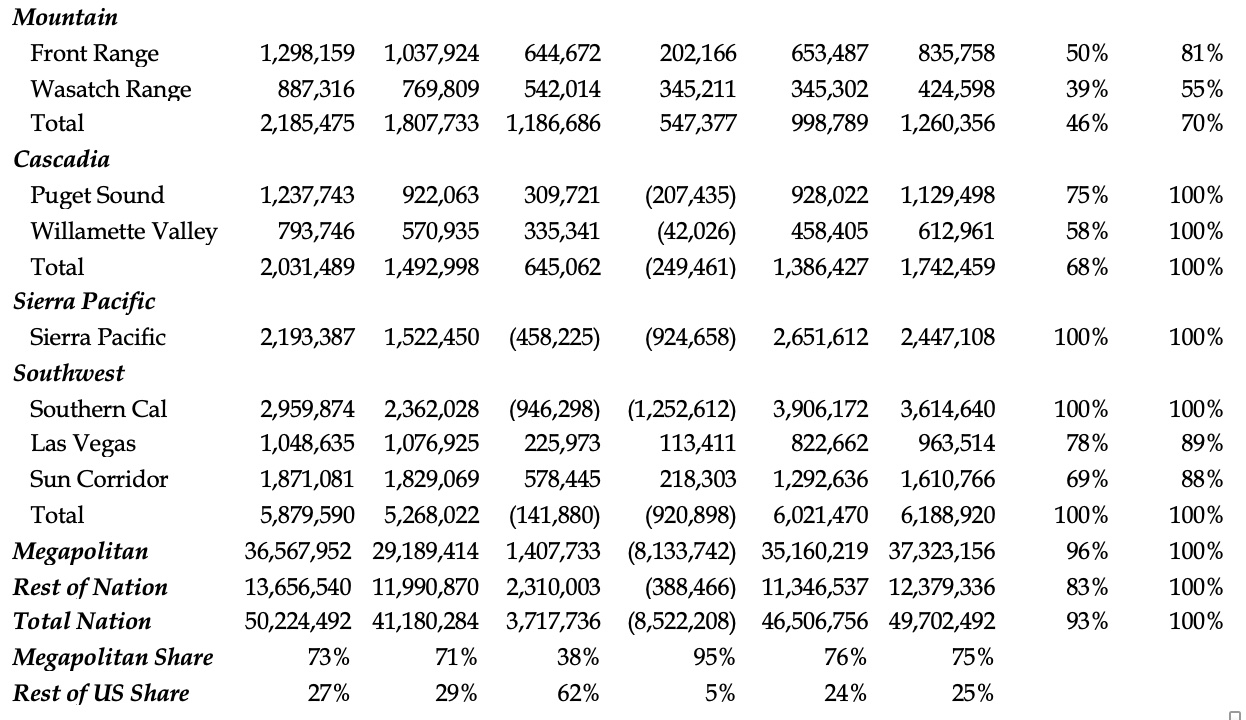
Table 2: Population Change Total, White, and Non-White by Megapolitan Area, 2000-2020 and 2020-2040. Source: Data for 2000 and 2020 from Census and 2040 from Woods & Poole Economics.
In homage to Gottmann, Figure 10 shows the boundaries of the “Megalopolis” region with its individual megapolitan areas of New England, New York-Philadelphia, and Chesapeake.
During the period 1980 to 2010, Megalopolis added the second largest number of people at 6.3 million, being second to the Texas Triangle at a million more. During this period, all megapolitan areas grew substantially with New York-Philadelphia leading the way at three million. However, the Chesapeake megapolitan area is projected to grow the most over the period, adding nearly 1.8 million people to 1.2 million for New York-Philadelphia and about half a million for New England.
Between 1980 and 2010, Megalopolis led the megapolitan regions in the reduction of White persons at about 1.5 million, which is projected to will grow to more than 3.6 million during the next 30- year period, 2010-2040. The New York-Philadelphia megapolitan area dominates this trend with losses of 1.6 million and 2.7 million over each of the periods. Although the Chesapeake megapolitan area gained about 320,000 White persons, it is projected to lose about 280,000 of them going forward to 2040.
In contrast, non-Whites dominated population change in Megalopolis overall between 1980 and 2010, gaining more than Whites in other than the Chesapeake megapolitan area. Toward 2040, non-Whites will account for all growth in all the Megalopolis megapolitan areas. Indeed, these trends are replicated in all but the Mountain megapolitan region as well as the Las Vegas and Sun Corridor megapolitan areas., as will be seen below.
Population trends for the Piedmont megapolitan region are reviewed next.
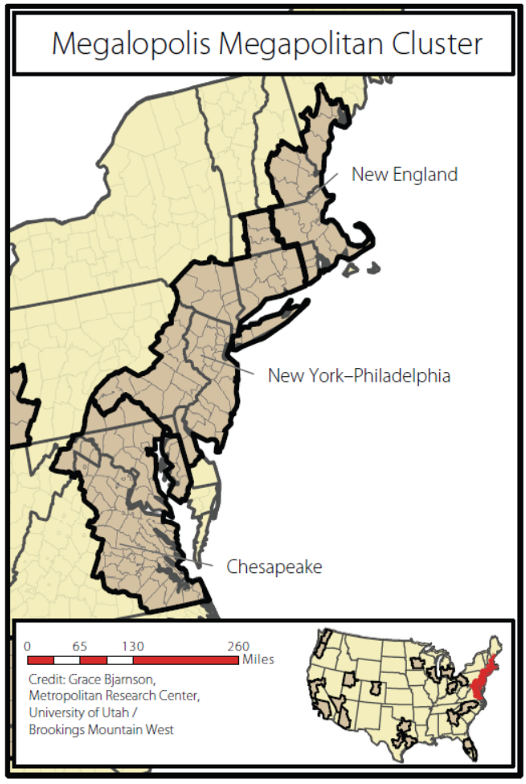
Figure 10: Megapolopolis Megapolitan Region.
Table 2 shows that the Piedmont Cluster megapolitan areas of Carolina and Atlanta (Figure 11) have very nearly identical population trends. Both added population at about the same amount during the period 2000-2020, about 2.4 million and 2.2 million respectively, and are projected to add similar amounts going forward to 2040, about 2.0 million and 1.9 million, respectively
While both gained White population between 2000 and 2020 at 930,000 and 390,000 respectively, the Atlanta megapolitan area is projected to lose 220,000 Whites going forward to 2040 while the Carolina megapolitan area is projected to add 470,000.
Both gained large shares of non-Whites during the period 2000 to 2020—1.4 million and 1.9 million, respectively—and both are projected to do the same from 2020 to 2040 at about 1.7 million and 2.1 million, respectively. In terms of overall share of population change, non-Whites accounted for 61 percent of the Carolina megapolitan area change between 2000and 2020 compared to 82 percent for the Atlanta megapolitan area. Going forward, these shares are projected to be 82 percent and 100- percent, respectively
As will be seen next, the Florida megapolitan areas are in stark contrast to the similarities seen in Piedmont megapolitan areas.
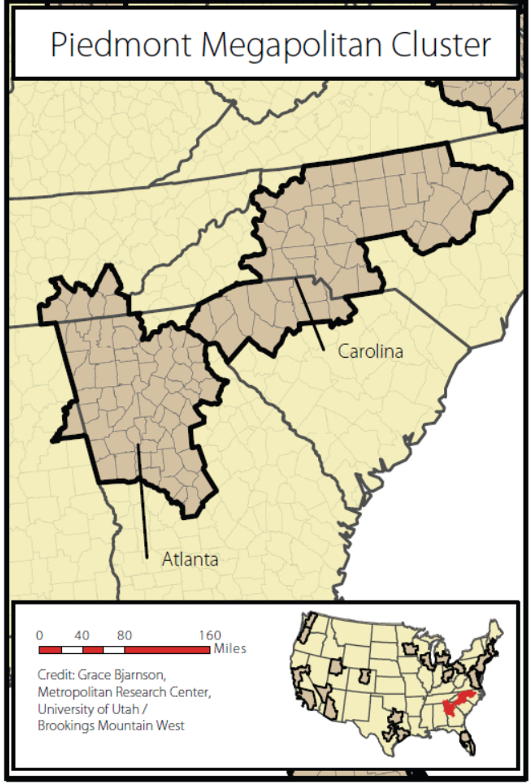
Figure 11: Piedmont Megapolitan Cluster.
The Florida megapolitan cluster (Figurer 12) includes the Florida Corridor (stretching across the state’s midsection from the Atlantic to the Gulf of Mexico) and Florida Atlantic megapolitan areas; they have contrasting population trends.
Despite just a 10 percent difference in population in 2000, the Florida Corridor megapolitan area added more than twice the population than the Florida Atlantic megapolitan area between 2000 and 2020— 2.9 million compared to 1.3 million.
In another contrast, while the White population increased by 800,000 in the Florida Corridor between 2000 and 2020 and is projected to increase by another 430,000 going forward to 2040, the Florida Atlantic megapolitan area lost 340,000 White persons and is projected to lose another 240,000 White persons over these respective time periods. Nonetheless, in both the Florida Corridor and Florida Atlantic megapolitan areas, non-Whites dominated population growth during the period 2000 to 2020 at 2.1 million and 1.6 million, respectively. This dominance will continue going forward at 2.4 million and 1.5 million, respectively. Indeed, non- White population change accounted for all growthin the Florida Atlantic megapolitan area during both time periods while for the Florida Corrida it was somewhat less.
The Great Lakes Megapolitan Cluster is reviewed next which also includes contrasting trends among its megapolitan areas.
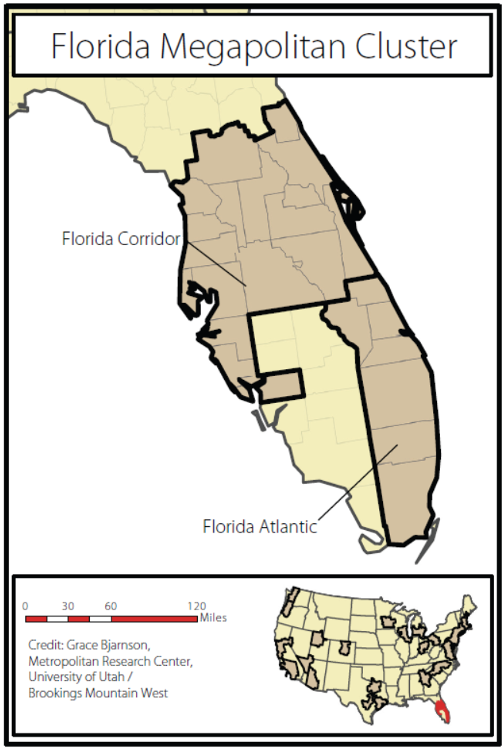
Figure 12: Florida Megapolitan Cluster.
The Great Lakes Megapolitan Cluster has the largest number of megapolitan areas including the Steel Corridor, Ohio Valley, Michigan Corridor, and Chicago. Among them, the Steel Corridor has been in decline while the Michigan Corridor and Chicago megapolitan areas are stagnating with growth below the national average, but the Ohio Valley megapolitan area is stable.
Figure 13 illustrates the Great Lakes Megapolitan Cluster. Among the 23 megapolitan areas, the Steel Corridor is the only one in decline. It lost 230,000 people between 2000 and 2020 and is projected to lose another 230,000 from 2020 to 2040. It lost White population in even larger numbers with 490,000 fewer White persons in 2020 than in 2000; it is projected to lose another 600,000 White persons going forward to 2040.
Yet, it has been and will be non-White persons who have grown considerably. Between 2000 and 2020, non-Whites increased by 260,000 and they are projected to increase by another 370,.000 to 2040. An obvious growth policy in the Steel Corridor would leverage its growth among non-Whites.
Although growing slightly, in many ways, the Michigan Corridor megapolitan areas has the same population trends as the Steel Corridor. Between2000 and 2020, it grew by only 130,000 on a base of 8.7 million—the fifth most populous among the 23 megapolitan areas in 2000. Going forward to 2040, the Michigan Corridor megapolitan area is projected to add just 40,000 more people. Following the Steel Corridor trend, the Michigan Corridor lost 290,000 White persons between 2000 and 2020 and is projected to lose another 680,000 to 2040. It has been and will be non-White persons who are growing in the Michigan Corridor, from 420,000 between 2000 and 2020 to 720,000 to 2040. Like the Steel Corridor, it would seem that leveraging non-White population growth would be a prudent strategy.
As the third largest megapolitan area, Chicago megapolitan area grew only modestly between 2000 and 2020 at 620,000 persons and is projected to add just 230,000 more to 2040. Its growth rate is well below the national average. Following trends in other megapolitan areas, it lost 440,000 White persons between 2000 and 2020 and is projected to lose another 960,000 going forward to 2040. On the other hand, all its growth is attributable to non-White persons who increased in number by 1.1 million during the period 2000 and 2020 and is projected to increase by another 1.2 million to 2040.
In contrast to the other megapolitan areas in the Great Lakes cluster, the Ohio Valley megapolitan area saw robust growth of 700,000 persons over the period 2000 to 2020 and is projected to grow by another 520,000 persons to 2040. Although its White population grew by 190,000 people from 2000 to 2020, that population is projected to fall by 120,000 people between 2020 and 2040. Following trends elsewhere, most of its growth between 2000 and 2020 was among non-Whites, at 520,000 with another 720,000 projected to 2040.
What follows is a review of population trends for the Twin Cities megapolitan area.
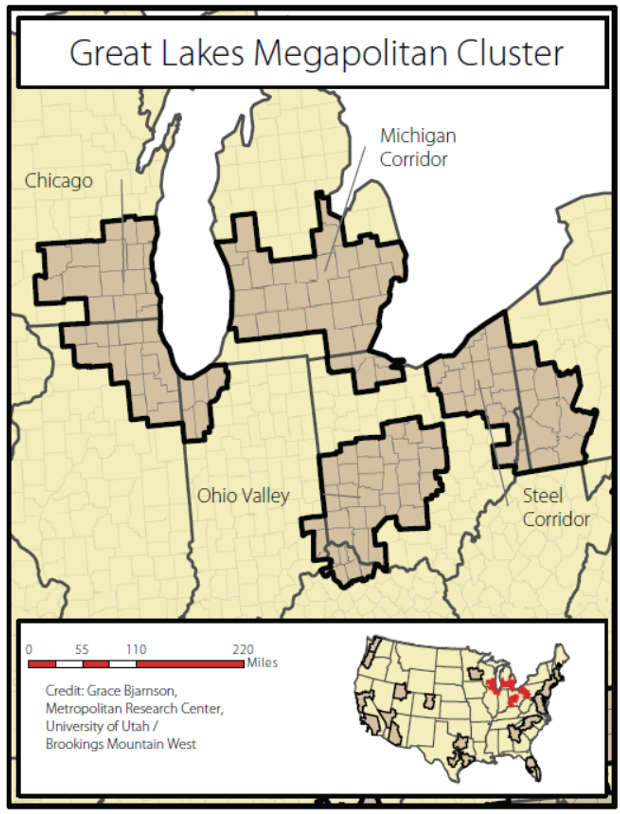
Figure 13: Great Lakes Megapolitan Cluster
Because it is too distant from the Great Lakes and just outside the economic exchange thresholds of Chicago, the Twin Cities megapolitan area (Figure 14) is only one of two that are not assigned to a megapolitan cluster.
The Twin Cities megapolitan area saw robust growth of 760,000 between 2000 and 2020 and is projected to gain another 540,000 toward 2040. Growth among White persons accounted for 200,000 or 27 percent of the change over the period 2000 to 2020 but it is projected to decline by 380,000 between 2020 and 2040. During both periods, the non-White population dominated growth and is projected to account for all growth to 2040.
The nation’s fastest growing megapolitan cluster is the Texas Triangle which is presented next.
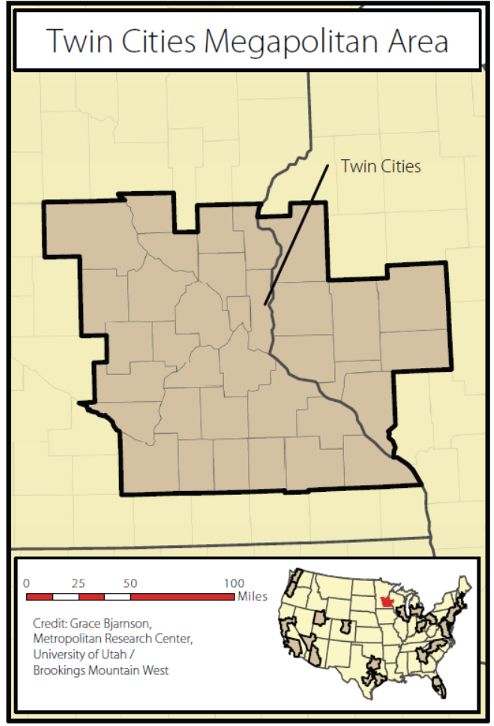
Figure 14: Twin Cities Megapolitan Cluster.
The Texas Triangle Megapolitan Cluster includes the Dallas-Fort Worth, Central Texas, and Houston megapolitan areas (Figure 15).
Overall, the Texas Triangle has added more people than any other megapolitan cluster—7.3 million between 2000 and 2020, and is projected to add more people to 2040—6.8 million to 2040.
Between 2000 and 2020, the Dallas-Fort Worth megapolitan area added the greatest number of people in the Texas Triangle, 2.7 million, followed by Houston at 2.5 million and Central Texas at 2.0 million, although Central Texas had the higher growth rate at 61 percent. Going forward to 2040, the order of growth is projected to remain the same at 2.6 million, 2,3 million, and 1.9 million new residents, respectively
Although all megapolitan areas gained in White population over the period 2000 to 2020—by 380,000, 250,000 and 620,000 respectively, toward 2040 the White population is projected to fall in the Dallas-Fort Worth and Houston megapolitan areas by 120,000 and 210,000 people, respectively. The Central Texas White population is projected to increase by 450,000. In all megapolitan areas, however, nonWhite population dominated growth between 2000 and 2020 by 86 percent, 90 percent, and 70 percent, respectively, and is projected to become even more dominant to 2040 at 100 percent each for Dallas-Fort Worth and Houston, and 70 percent for Central Texas.
The next section summarizes population trends for the Mountain megapolitan cluster.
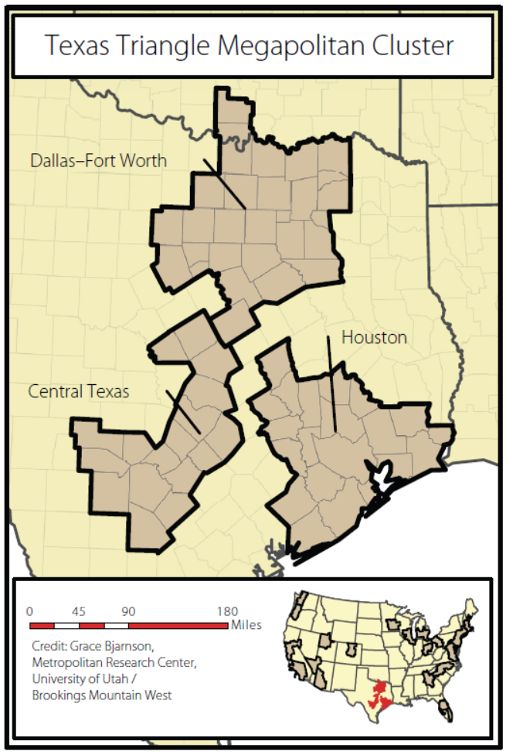
Figure 15: Texas Triangle Megapolitan Cluster.
The Front Range and Wasatch Front megapolitan areas comprise the Mountain Megapolitan Cluster.
The only two megapolitan areas where non-White population growth did not dominate growth between 2000 and 2020 are the Front Range and Wasatch Front. During the period of time, population increased by 1.3 million and 890,000, respectively. The increase in White population was 640,000 and 540,000, accounting for 50 percent and 61 percent of growth, respectively.
Following national trends, however, most of the growth in both megapolitan areas will be mostly non-White persons. Of the 1.0 million new residents projected for the Front Range between 2020 and 2040, 840,000 or 81 percent would be non-White. For the Wasatch Front, projections show that non-Whites would increase by 420,000, or about 55 percent of 770,000.
Growth trends for the Cascadia Megapolitan Cluster are presented next.
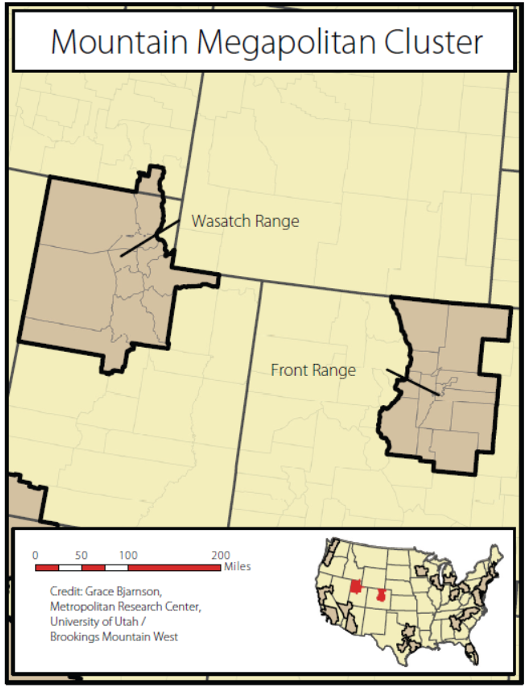
Figure 16: Mountain Megapolitan Cluster.
The Cascadia Megapolitan Cluster is comprised of the Puget Sount and Willamette megapolitan areas.
The Puget Sound and Willamette megapolitan areas grew at about the same rate between 2000 and 2020, totaling 1.2 million and 800,000 people, respectively. They are projected to grow at a slightly slower pace over the period 2020 to 2040, adding 1.0 million and 770,000 people, respectively.
The Puget Sound and Willamette megapolitan areas (Figure 17) grew at about the same rate between 2000 and 2020, totaling 1.2 million and 800,000 persons, respectively. They are projected to grow at a slightly slower pace over the period 2020 to 2040, adding 1.0 million and 770,000 people, respectively.
Non-Whites dominated population change between2000 and 2020, accounting for 75 percent of the growth or 930,000 people in the Puget Sound megapolitan area and 58 percent or 460,000 of the growth in the Willamette megapolitan area.
Going forward to 2040, however, non-White persons will account for all the population change in both megapolitan areas.
The Sierra Nevada megapolitan area is the only other megapolitan area that is not assigned to a megapolitan cluster. Its population trends are assessed next.
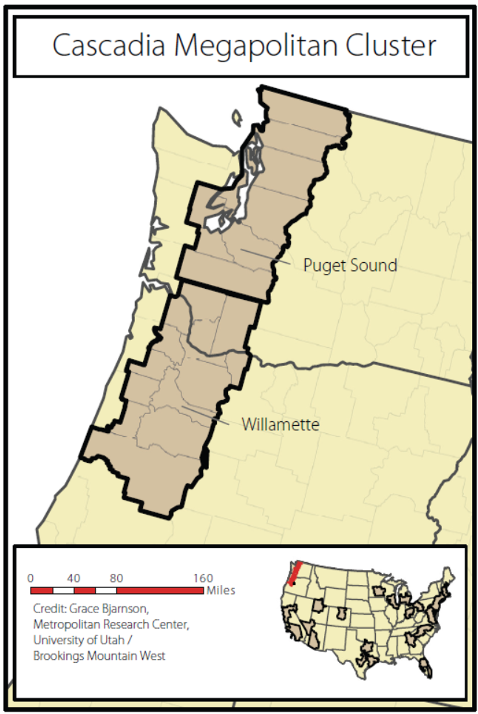
Figure 17: Cascadia Megapolitan Cluster.
Like the Twin Cities megapolitan area, the Sierra Pacific megapolitan is too distant from any other megapolitan area—such as Southern California—to have meaningful economic exchange, and as such it is not assigned to a megapolitan cluster
Between 2000 and 2020, the Sierra Pacific megapolitan area added 2.2 million people and it is projected to add another 1.5 million going forward to 2040. Its White population, however, declined by 460,000 between 2000 and 2040, and is projected to decline at twice that figure to 920,000 between 2020 and 2040. The non-White population has dominated growth from 2000 to 2020, being 2.7 million and it is projected to increase by another 2.4 million to 2040.
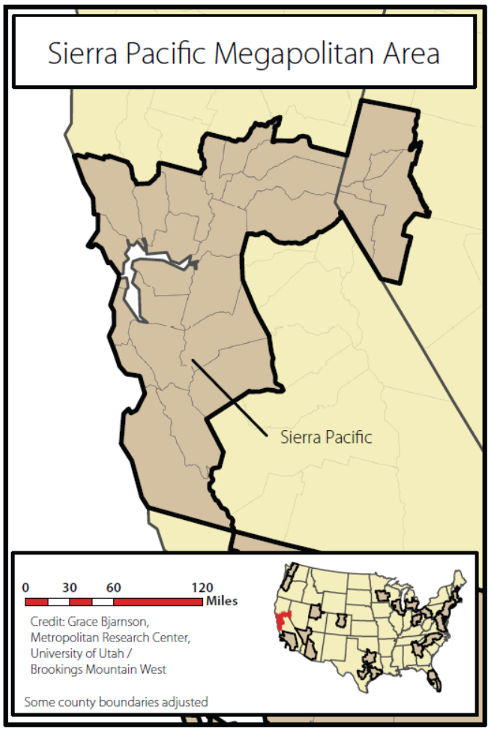
Figure 18: Sierra Pacific Megapolitan Area
The Southwest Megapolitan Cluster (Figure 19) is made up of the megapolitan areas of Southern California, Las Vegas, and the Sun Corridor.
Over the period from 2000 to 2020, the Southern California megapolitan area added 3.0 million people— just slightly less than the New YorkPhiladelphia megapolitan area, while the Sun Corridor added 1.9 million people and Las Vegas added 1.0 million people. Over the next 20 years to 2040, these megapolitan areas are projected to add 2.4 million, 1.8 million, and 1.1 million people, respectively.
Only the Southern California megapolitan area lost or is projected to lose White residents during the study period, being 900,000 over the period 2000 to 2020 and projected at 1.3 million from 2020 to 2040. In contrast, the Sun Corridor and Las Vegas megapolitan areas increased their White populations by 580,000 and 230,000 persons, respectively, and are projected to add 220,000 and 110,000 White persons respectively to 2040.
Nonetheless, non-White persons dominated growth across all megapolitan areas between 2000 and 2020 at 3.9 million people for Southern California, 1.3 million people for the Sun Corridor, and 800,000 persons for Las Vegas. These trends are projected to continue ton 2040 resulting in 3.6 million, 1.6 million, and 960,000 new non-White persons for those megapolitan areas, respectively.
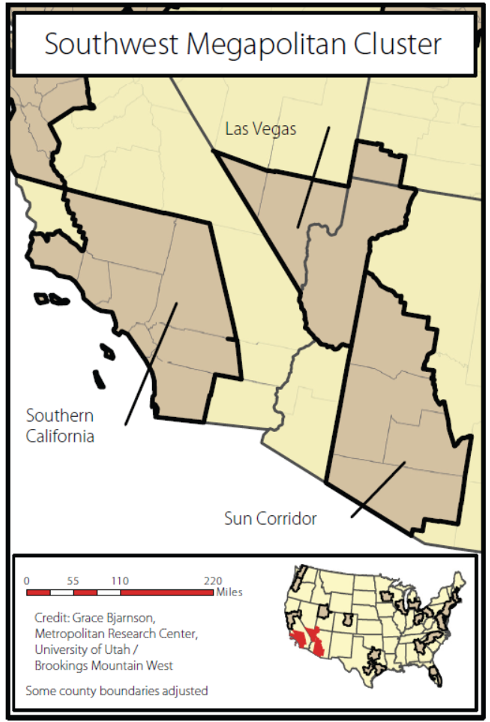
Figure 19: Southwest Megapolitan Area.
This part expands on demographic trends facing America and in particular megapolitan America by assessing changes in households by age cohort. This leads to implications for the nature of housing demand going forward to 2040. As will be shown, much of America is over-built with homes intended to serve Baby Boom households at their peak demand for housing. The future demand for housing will be very different than in the past.
Baby Boomers were born between 1946 and 1964. On a 1945 base of 140 million Americans, more than 70 million babies were born from 1946 through 1964. No other period experienced such a shift in the nation’s demographics. The post-WWII economy combined with federal housing programs enabled a whole generation of parents to buy homes in which to raise their children. But it was when Boomers grew up and had families of their own that America’s landscape morphed into a predominantly suburban one.
The analysis in this part compares the change in number of households between 1980 and 2010 by age cohort and then projects the change in households for those cohorts between 2010 and 2040. The period 1980 to 2010 corresponds with the peak period during which Baby Boomers raised their children and often sought larger homes on larger lots in the suburbs to meet their demands. The end-year of 2010 is used because it is close to the year 2011 in which Boomers began turning 65 and therefore became “empty-nesters,” preparing to downsize. It also signaled the beginning of the end of boomer’s peak housing demand.
The change in household demographics for the period 1980 to 2010 is compared to an equal 30-year period, 2010 to 2040, during which Boomer households will have substantially passed through the economy. According to actuarial tables, most Boomers will have passed away by then and most of those who remain would be in various forms of retirement living arrangements, often without a home of their own.
The report thus shows the change in households from 1980 to 2010 based on three age cohorts:
The report then projects the number of householders by these age cohorts in 2040. Doing so allows analysis of the nature of the change in demand for housing over time by age cohort.
Because no agency or firm projects the number of householders by age cohort for futures, that estimate is done here. The projection uses the headship rate.
Since the late 1930s, the U.S. Census has pioneered development of the headship rate method to project future households and, by implication, housing needs. It is used routinely in projecting households as well as to track changes in headship rates over time. The headship rate is calculated simply as the number of householders in an age group divided by the number of adults (persons over 15) in the same age group. The metric can be calculated broadly such as an overall national rate. It can also be calculated for specific age groups as well as for the race and ethnicity of households. The higher the rate, the more households are in the age group. For instance, if there are 100 householders aged 35 to 64 and there are 200 persons in the same age group, the headship rate is 0.50. A headship rate of 1.00 means there are just as many householders as there are people in the same age group. Moreover, because the headship rate is based on total householders relative to total adult population, it implicitly adjusts for persons in group facilities such as dorms, correctional facilities, nursing homes, and so forth. Research by Harvard’s Joint Center for Housing Studies shows that while headship rates vary by age and race/ethnicity, they are relatively stable within those factors over time (McCue and Herbert 2016).
The headship rate used for this report is based on the 2000 decennial census for each age cohort: 15-34, 35-64, and 65 and older. The analysis also calculates headship rates for white non-Hispanic (simply “white” hereafter) and non-white (all other) householders. Recall that the JCHS concludes that headship rates during the 21st century have been reasonably stable.
Using the 2000 census as the foundation for applying headship rates to future years such as 2022 is reasonable base for these additional reasons:
Table 3 shows the change in householders for each of three age cohorts over the period 1980-2010 and 2010- 2040 for the nation, megapolitan areas, and the rest of the nation while Figure 20 illustrates the results for just the nation (trends are consistent across all geographies).
In Table 3, the influence of boomer householder demand for homes at the peak stage of housing consumption—35-64—is evident. Between 1980 and 2010, 75 percent of the new demand for homes nationally was driven by these householders. In contrast, the demand for starter homes fell nationally by one percent during this period while the national demand for downsizing homes to serve the needs of householders aged 65 years and over was 26 percent. An anomaly occurs: whereas megapolitan areas saw a decline in starter home householders during the period 1980-2010 like the national trend while the rest of nation saw a small increase, but megapolitan areas will account for 82 percent of such new householders going forward to 2040, numbering about 2.8 million.
Over the next 30-year period, 2010-2040, the nature of demand flips. While the demand to meet the needs of new householders aged 35 to 65 falls to 22 percent, the demand to meet the needs of downsizing households increases to 67 percent. Another 10 percent of the net change in demand is attributable to starter home householders.
This leads to important implications for housing policy and planning, such as:
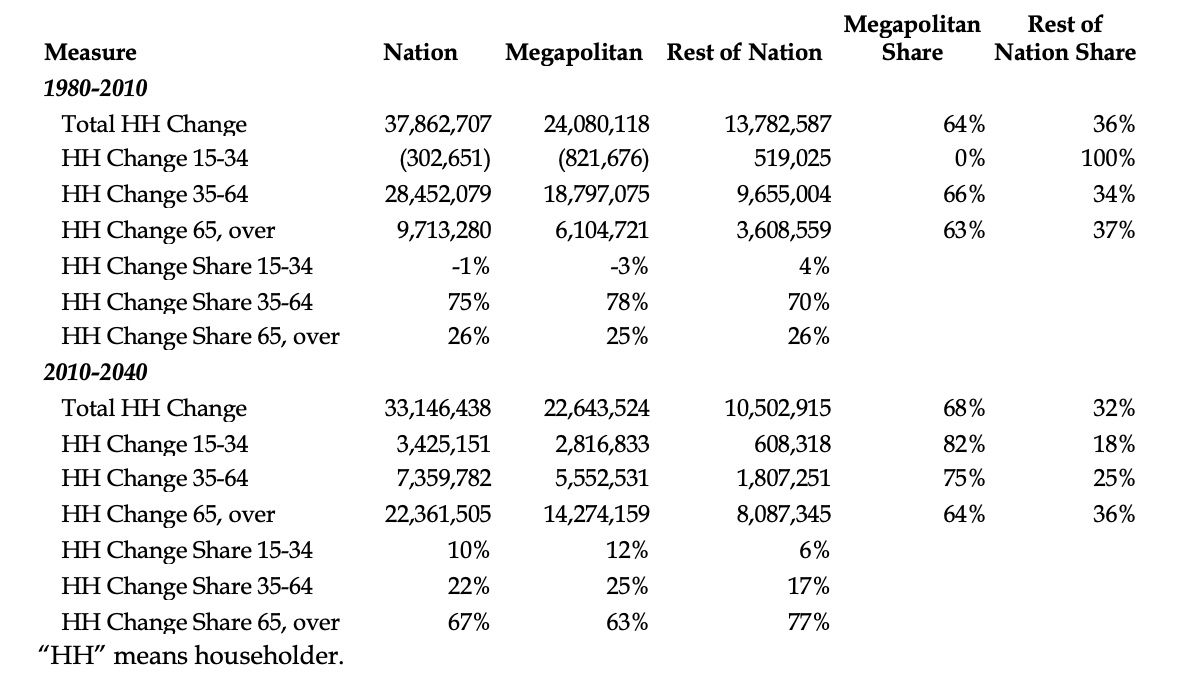
Table 3: Change and Share of Change of Householders by Age Cohort for the Nation, Megapolitan Areas, and Rest of Nation, 1980-2010 and 2010-2040. Source: Census and Woods & Poole Economics data compiled by Arthur C. Nelson.
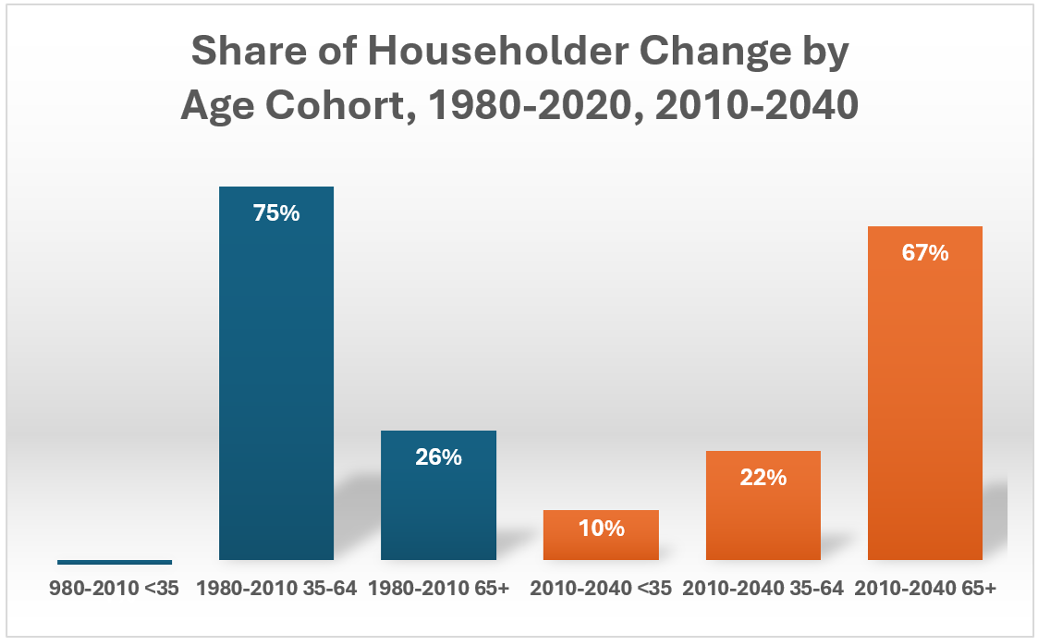
Figure 20: Share of Change in Householders by Age, Nation, 1980-2010 (blue) and 2010-2040 (orange)
Table 4 presents information on the nature of householder change by age cohort for the Megalopolis megapolitan areas of New England, New York-Philadelphia, and Chesapeake.
Following national trends, the New England and New York-Philadelphia megapolitan areas lost starterhome households substantially during the period 1980-2010 at 19 percent and 24 percent, respectively. The Chesapeake megapolitan area was the exception with only a negligible loss. But, even more dramatic than national trends, the change in householders during the peak housing demand stage of their cycle in the New England and New York-Philadelphia megapolitan areas dominated those markets during this period at 95 percent and 92 percent, respectively, compared to 75 percent for the nation. The Chesapeake megapolitan area followed national trends. All megapolitan areas trended closely with national share of change among downsizing households.
However, the Megalopolis megapolitan areas are projected to perform in ways that are vastly different than national trends going forward to 2040 across all three householder cohorts. While the share of change among starter home householders will be about the same, the share of change among peak housing householders— between 35 and 64 years of age—will be single-digits for the New England and New York-Philadelphia megapolitan areas (8 percent and 3 percent, respectively), and negative for the Chesapeake megapolitan area (-7 percent). In contrast, the trend nationally and for megapolitan areas projects a 22 percent and 25 percent share of householder change in the peak housing householder cohort, respectively.
Downsizing householders—those 65 years of age and over--are projected to account for 82 percent of the change among all householders in the New England megapolitan area, 84 percent in the New York-Philadelphia megapolitan area, and all of the Chesapeake megapolitan area. This is in stark contrast to national and megapolitan-wide projections of 67 percent and 63 percent, respectively.
Is the Megalopolis megapolitan cluster headed for a demographic-based housing mismatch train wreck by 2040? These megapolitan areas are not alone as will be seen below. The concluding section will outline policy responses.
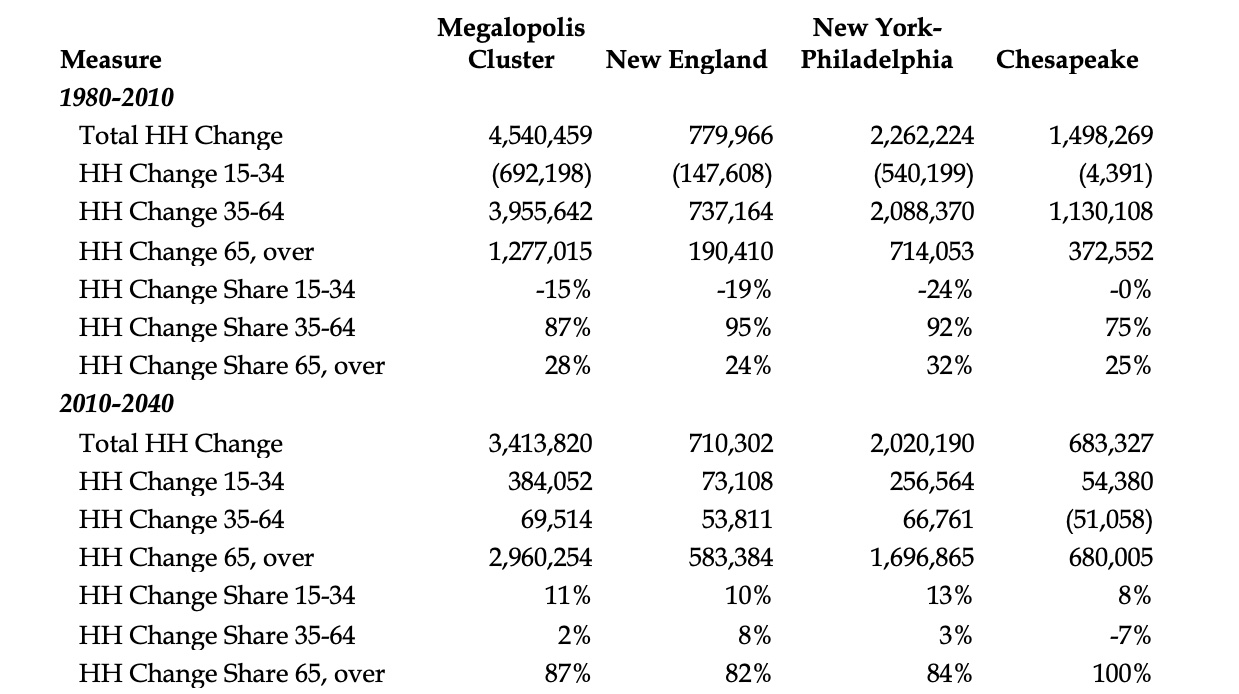
Table 4: Change and Share of Change of Householders by Age Cohort for the Megalopolis Megapolitan Cluster, 1980-2010 and 2010-2040. Source: Census and Woods & Poole Economics data compiled by Arthur C. Nelson.
Since the Piedmont, coastal plains, and Atlantic seaboard share the Appalachian landscape as well as similar history, culture, and economic base, it may not be too surprising that they share similar householder age cohort trends. This is shown in Table 5.
During the period 1980 to 2010, the Carolina and Atlanta megapolitan areas added 1.4 million householders each, distributed roughly equally among starter home, peak housing and downsizing householders at 8 percent, 69 percent, and 23 percent respectively in the Carolina megapolitan area, and 10 percent, 71 percent, and 19 percent respectively in the Atlanta megapolitan area.
Trends are projected to be similar going forward to 2040 with the Carolina megapolitan area adding 1.6 million householders and the Atlanta megapolitan area adding 1.4 million householders. The distribution of the share of change in householders by starter home, peak housing, and downsizing age cohorts will be even more similar compare to the period 1980 to 2010 with the Carolina distribution being 19 percent, 28 percent, and 52 percent respectively compared top the Atlanta megapolitan distribution being 18 percent, 31 percent, and 51 percent, respectively.
Similar cohort distributional trends for the Florida megapolitan cluster will be seen next.
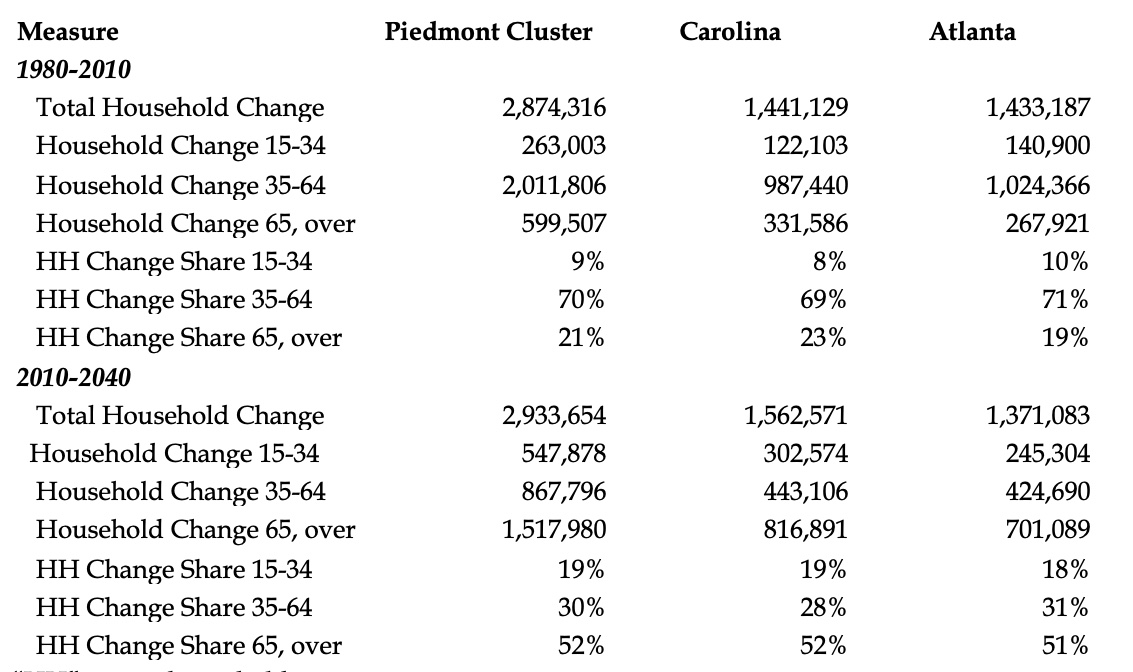
Table 5: Change and Share of Change of Householders by Age Cohort for the Piedmont Megapolitan Cluster, 1980-2010 and 2010-2040. Source: Census and Woods & Poole Economics data compiled by Arthur C. Nelson.
Table 6 reports the distribution of share of change in householders by age cohort for the Florida Corridor and Florida Atlantic megapolitan areas for 1980 and 2010, and projected for the period 2010 tom 2040.
Between 1980 and 2010, the share of change among starter home householders in the Florida Corridor megapolitan was nearly twice as high as the Florida Atlantic megapolitan area: 11 percent compared to 6 percent. On the other hand, the share of change among peak housing householders favored the Florida Atlantic megapolitan area corridor by 71 percent compared to the Florida Corridor megapolitan area at 62 percent. The shares of change among downsizing householders favored the Florida Corridor megapolitan area at 28 percent compared to 23 percent for the Florida Atlantic megapolitan area.
Going forward to 2040, both megapolitan areas as projected to have nearly the same share of change among starter home householders at 12 percent for the Florida Corridor megapolitan area and 11 percent for the Florida Atlantic megapolitan area. Among peak housing demand householders, the Florida Corridor megapolitan area is projected to account for 30 percent of the change compared to 22 percent for the Florida Atlantic megapolitan area. However, among the downsizing householders, the share of change in the Florida Atlantic megapolitan area is projected at 67 percent compared to 59 percent for the Florida Corridor megapolitan area.
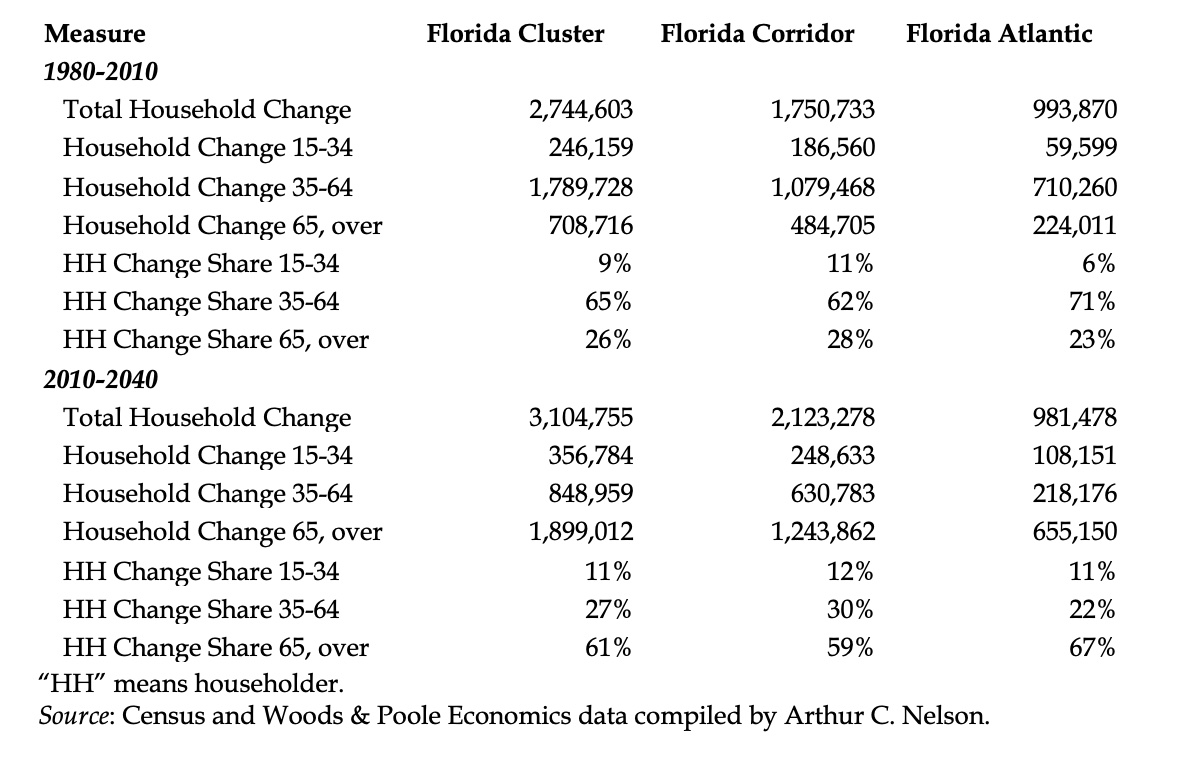
Table 6: Change and Share of Change of Householders by Age Cohort for the Florida Megapolitan Cluster, 1980-2010 and 2010-2040. Source: Census and Woods & Poole Economics data compiled by Arthur C. Nelson.
Unlike megapolitan areas in most other megapolitan clusters, those in the Great Lakes megapolitan cluster have one thing in common: they have quite different householder age cohort trends. Each will be reviewed on its own, therefore. Information is summarized in Table 7.
As noted above, the Steel Corridor megapolitan area is the only one losing population among the 23 megapolitan areas. However, it has been adding householders though mostly because an aging population is associated with declining average household size, which translates into more households given the same population. This will be seen during the period from 2010 to 2040.
Between 1980 and 2010, although the Steel Corridor lost 230,000 people, it added 180,000 householders. On the other hand, its distribution of householder growth is very uneven. While it lost 250,000 starter home householders, it gained 270,000 peak housing householders along with 170,000 downsizing householders. In going forward to 2040, however, trends are troubling.
Over the period 2010 to 2040, the Steel Corridor megapolitan area is projected to grow by 80,000 householders but this will be driven by the addition of 350,000 downsizing householders who have smaller household sizes than other age cohorts. In contrast, peak housing householders will be reduced by 230,000 and starter home householders will fall by another 40,000.
The Michigan Corridor megapolitan area has somewhat similar though less draconian trends. While it added 540,000 householders between 1980 and 2010, it lost 320,000 starter home householders. Like the Steel Corridor, it gained considerable numbers of peak housing householders—600,000 and also added 270,000 downsizing householders.
During the period 2010 to 2040, the Michigan Corridor is projected to add 480,000 householders which includes gains of 30,000 starter home householders. But, like the Steel Corridor, the gain of 500,000 new downsizing householders will exceed overall household growth. In addition, peak housing householders is projected to fall by 120,000.
As the largest megapolitan area in the Great Lakes megapolitan cluster, the Chicago megapolitan area grew by 1.0 million householders during the period 1980 to 2010, and is projected to add 490,000 householders going forward to 2040. Although it lost 220,000 starter home households between 1980 and 2010, it gained 900,000 peak housing and 280,000 downsizing households.
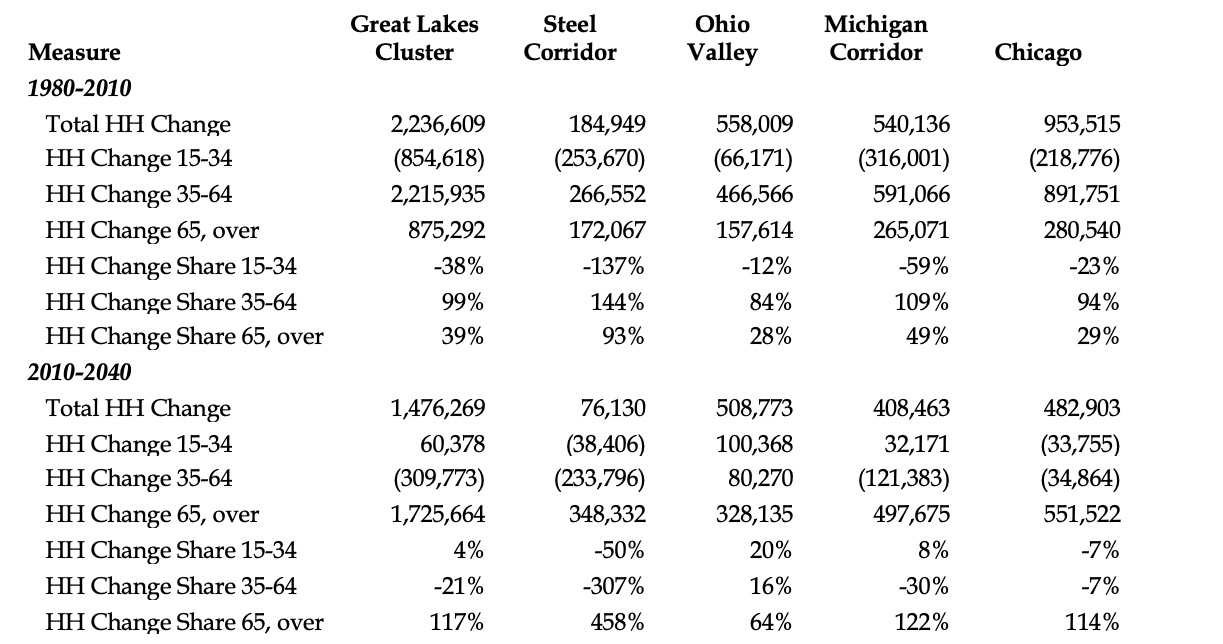
Table 7: Change and Share of Change of Householders by Age Cohort for the Great Lakes Megapolitan Cluster, 1980-2010 and 2010-2040. Source: Census and Woods & Poole Economics data compiled by Arthur C. Nelson.
Likewise, going forward to 2040, the Chicago megapolitan area is projected to lose 30,000 starter home and another 30,000 peak housing households and will gain 550,000 downsizing households.
In contrast to these three megapolitan areas, the Ohio Valley is trending more favorably. Although it lost starter home householders (70,000) between 1980 and 2010, just like nearly every other megapolitan area, gained 560,000 householders overall including 470,000 peak housing householders and 160,000 downsizing ones.
However, going forward to 2040, the Ohio Valley megapolitan area will gain 500,000 householders with increases is all age cohorts at 100,000, 80,000, and 330,000 starter home, peak housing, and downsizing householders, respectively.
The Twin Cities megapolitan area trends similarly to the Ohio Valley megapolitan area, as will be seen next.
Table 8 reports trends for the Twin Cities megapolitan area, which trends reasonably close to the Ohio Valley megapolitan area, as noted above.
Over the period 1980 to 2010, the Twin Cities megapolitan area added 600,000 householders with 490,000 or 82 percent among peak housing householders and 120,000 or 20 percent among downsizing householders. It lost 10,000 starter home householders.
Going forward to 2040, the Twin Cities megapolitan area is projected to add 420,000 householders with 60,000 or 15 percent among starter home, 80,000 or 19 percent among peak housing, and 280,000 or 66 percent among downsizing householders.
The nation’s most robust megapolitan cluster, the Texas Triangle, is presented next.
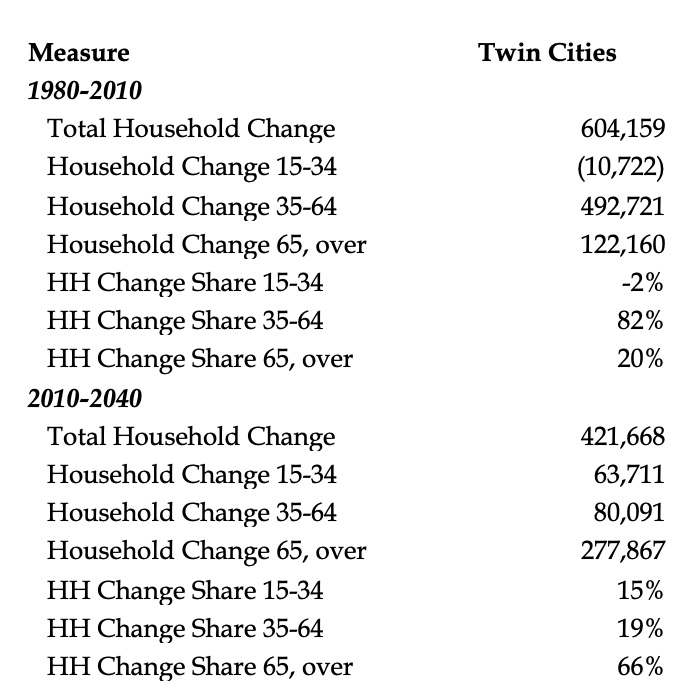
Table 8: Change and Share of Change of Householders by Age Cohort for the Twin Cities Megapolitan Area, 1980-2010 and 2010-2040. Source: Census and Woods & Poole Economics data compiled by Arthur C. Nelson.
At 4.5 million new householders, the Texas Triangle Megapolitan Cluster is projected to add the largest number of householders between 2010 and 2040 of all the megapolitan clusters, through the Southwest Cluster is a very close second. Table 9 presents changes in householders by age cohort for the selected time periods.
During the period 1980 to 2010, the distribution of new householders was dominated by peak housing householders at 72 percent for the Dallas-Fort Worth, 65 percent for the Central Texas, and 76 percent for the Houston megapolitan areas. They all added comparable shares of downsizing households at 16 percent, 17 percent, and 20 percent, respectively. However, the share of change of householders among starter homes increased by on 4 percent in the Houston megapolitan area compared to 12 percent for the Dallas-Fort Worth and 18 percent for the Central Texas megapolitan areas.
Going forward to 2040, the share of change of householders among the Texas Triangle megapolitan areas will be remarkably similar. Among starter home householders, the shares of change is projected to be 20 percent, 17 percent and 16 percent respectively for the Dallas-Fort Worth, Central Texas, and Houston megapolitan areas. The shares for peak housing households are projected at 40 percent, 45 percent, and 42 percent, respectively, while the respective shares for downsizing households are projected at 40 percent, 38 percent, and 42 percent.
Indeed, only the Mountain megapolitan areas have comparable shares of change among householder age cohorts between 2010 and 2040. Their trends are reviewed next.
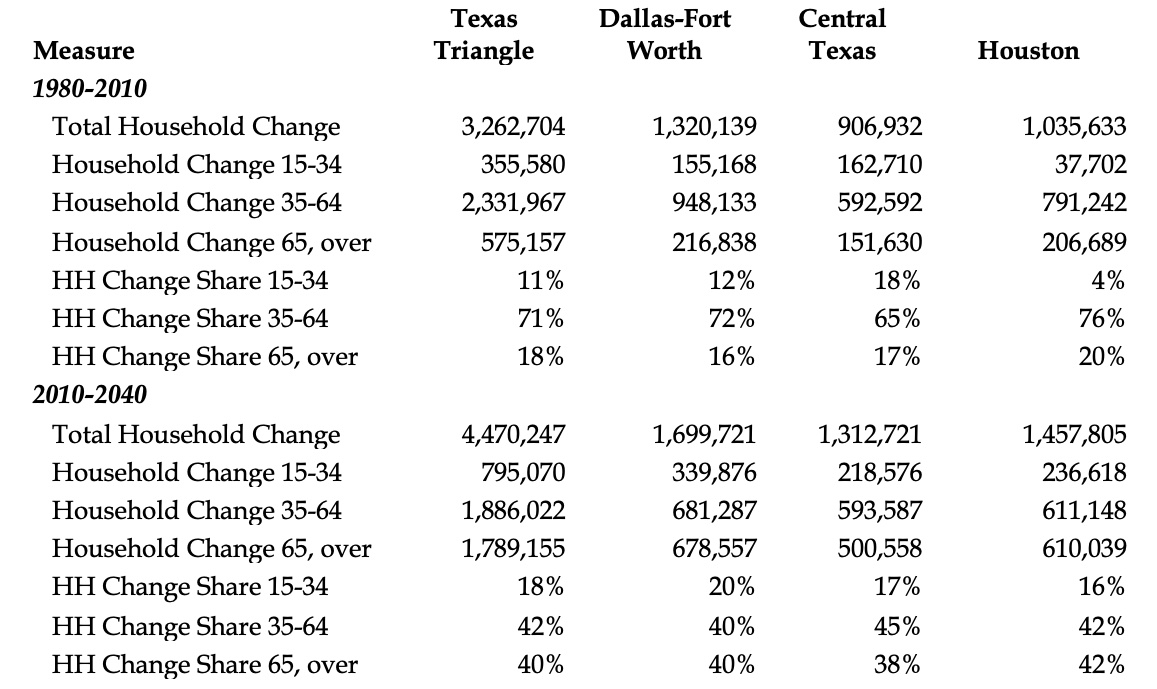
Table 9: Change and Share of Change of Householders by Age Cohort for the Texas Triangle Megapolitan Cluster, 1980-2010 and 2010-2040. Source: Census and Woods & Poole Economics data compiled by Arthur C. Nelson.
Although the Mountain megapolitan cluster megapolitan areas of the Front Range and Wasatch Range is the smallest in terms of average population, they are also among the fastest growing. Trends in the change of householders by age cohort are shown in Table 10.
Over the period 1980 to 2010, peak housing households dominated the change in householder growth at 75 percent for the Front Range and 66 percent for the Wasatch Range megapolitan areas, respectively. Shares of change in starter home households were 5 percent and 15 percent, respectively, while the change in share of downsizing households were respectively 21 percent and 18m percent.
Unlike national trends but comparable to trends in the Sunbelt and western states, going forward to 2040, these megapolitan areas are protected to add peak housing householders at an impressive pace of 41 percent for the Front Range and 53 percent for the Wasatch Range. Their growth in starter home householders will also be higher than the national and megapolitan average at 15 percent and 14 percent, respectively. The Wasatch Range megapolitan area is projected to have lowest share of change among downsizing householders at 33 percent with the Front Range megapolitan area the third at 44 percent, behind the Central Texas megapolitan area at 38 percent.
The next section reviews householder trends for the Cascadia megapolitan cluster.
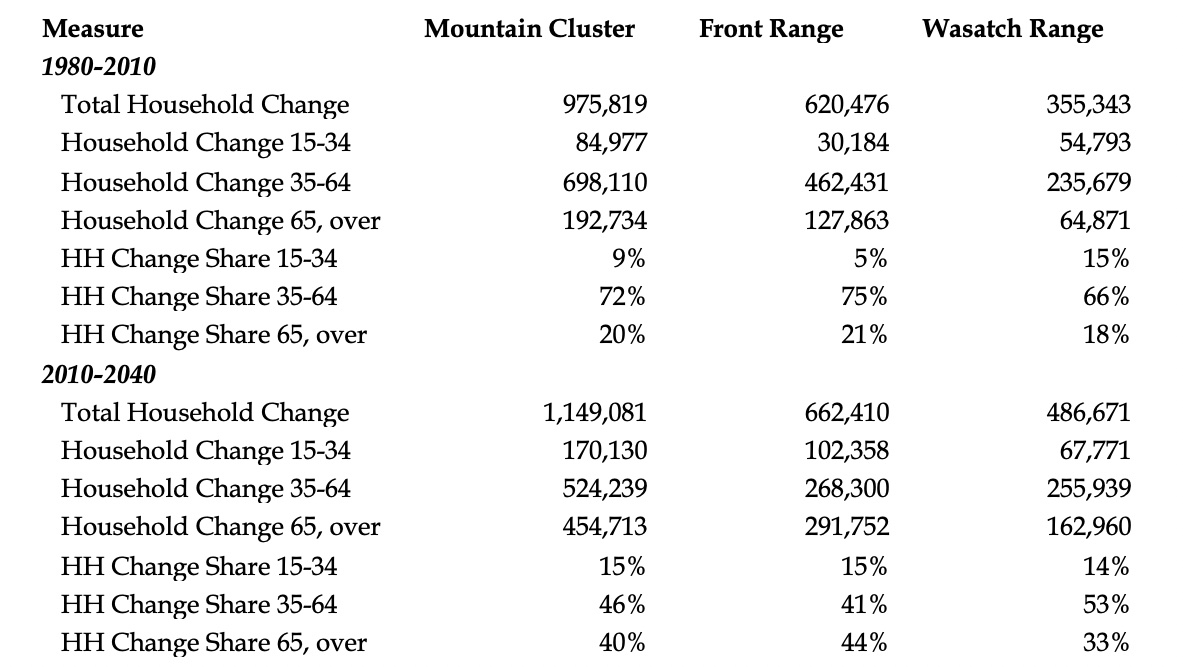
Table 10: Change and Share of Change of Householders by Age Cohort for the Mountain Megapolitan Cluster, 1980-2010 and 2010-2040. Source: Census and Woods & Poole Economics data compiled by Arthur C. Nelson.
The Cascadia megapolitan cluster includes the megapolitan areas of Puget Sound and Willamette. Householder trends over the selected time periods are reported in Table 11.
During the period 1980 to 2010, trends in the Cascadia megapolitan areas matched national and megapolitan trends closely. Where peak housing householders accounted for 75 percent and 78 percent of the share of change in householders, the figures for the Puget Sount and Willamette megapolitan areas were 75 percent and 79 percent, respectively. These megapolitan areas had slightly lower shares of downsizing householders at 21 percent and 23 percent, respectively, compared to the national average of 25 percent and the megapolitan average of 26 percent. Although the Willamette megapolitan area had about the same reduction in starter home householders at -2 percent, compared to -1 percent and -3 percent, respectively, the Puget Sound megapolitan area share of change was 4 percent.
In the future, from 2010 to 2040, the share of starter home households is projected to increase by 14 percent in the Puget Sound megapolitan area and by 10 percent in the Willamette megapolitan area. On the other hand, the share of change attributable to peak housing householders will be about half that of the earlier period, at 39 percent and 33 percent, respectively. Downsizing householders will account for more than twice the share of share from the previous 30-year period at 48 percent and 58 percent, respectively.
What follows are trends for the Sierra Pacific metropolitan area.
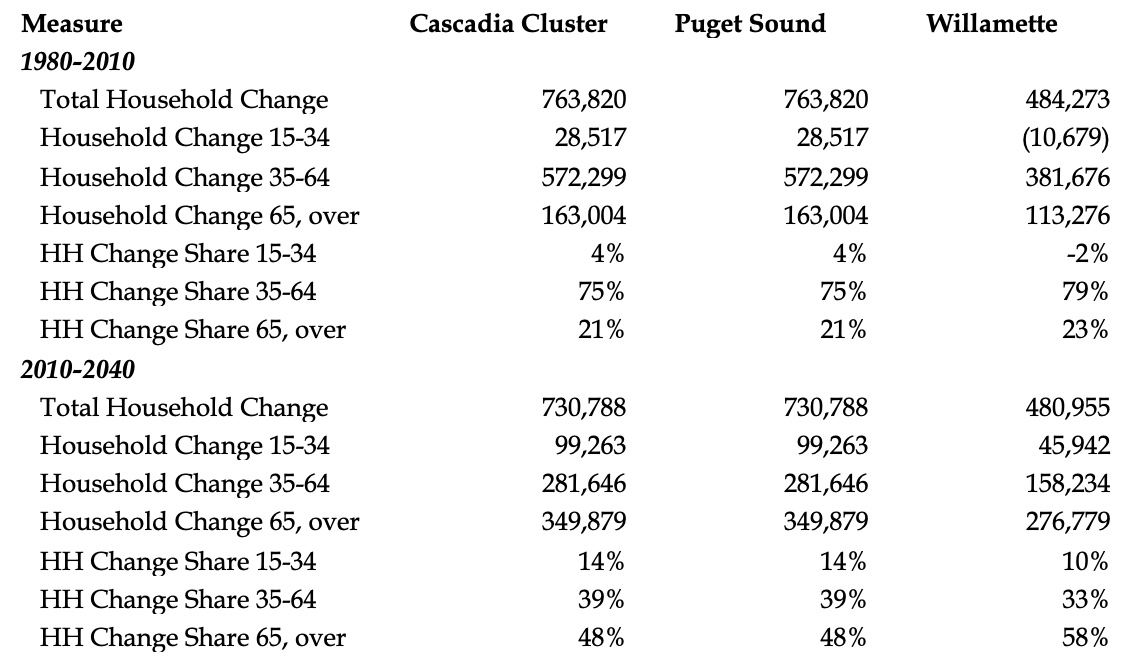
Table 11: Change and Share of Change of Householders by Age Cohort for the Cascadia Megapolitan Cluster, 1980-2010 and 2010-2040. Source: Census and Woods & Poole Economics data compiled by Arthur C. Nelson.
Among the Sunbelt and western megapolitan areas, analysis indicates that the Sierra Pacific megapolitan area is poised to see the sharpest reversal of trends, as seen in Table 12.
Between 1980 and 2010, 83 percent of the change in householders were peak housing ones. Yet, between 2010 and 2040, their share is projected to drop to 30 percent. Although starter home households are projected to rise from -11 percent in the earlier 30-year period to 8 percent going forward to 2040, downsizing households is projected to dominate the shift from 28 percent between 1980 and 2010, to more than double that at 63 percent between 2010 and 2040.
The last presentation in this suite of analyses addresses trends in the Southwest megapolitan cluster.
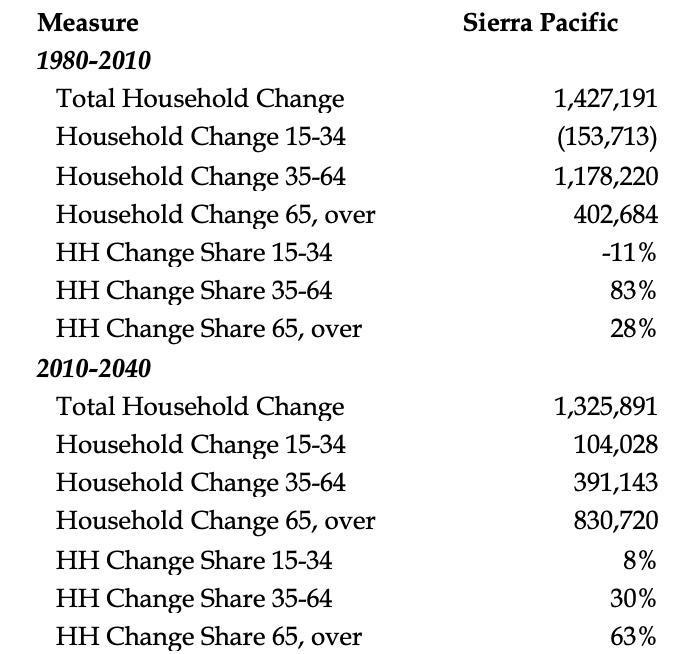
Table 12: Change and Share of Change of Householders by Age Cohort for the Sierra Pacific Megapolitan Area, 1980-2010 and 2010-2040. Source: Census and Woods & Poole Economics data compiled by Arthur C. Nelson.
The Megapolitan cluster with the second largest number of new householders (behind New York-Philadelphia) between 1980 and 2010 and the second largest number of new householders projected to 2040 (behind the Texas Triangle) is the Southwest. It is comprised of the Southern California, Las Vegas, and Sun Corridor megapolitan clusters.
During the base period of analysis, 1980 to 2010, started home householders in the Southern California megapolitan decreased by 11 percent but grew by 17 percent and 15 percent respectively in the Las Vegas and Sun Corridor megapolitan areas. On the other hand, the share of change among peak housing householders in Southern California increased by 85 percent compared to the megapolitan areas of Las Vegas at 59 percent and the Sun Corridor at 61 percent. All three megapolitan areas saw about the same share of change among downsizing householders at 26 percent, 24 percent, and 24 percent, respectively.
Going forward to 2040, the share of change attributable to downsizing households will be more than double to 63 percent, 52 percent, and 52 percent respectively while the share of peak housing householders will fall by more than half in the Southern California megapolitan area, to 29 percent, and fall to 33 percent for each of the Las Vegas and Sun Corridor megapolitan areas. Only the starter home householders will remain at a stable share of change relative to the baseline period at 15 percent for the Las Vegas and Sun Corridor megapolitan areas but rise from negative share to 7 percent in the Southern California megapolitan area.
Implications for these trends on housing policy are presented in the final part of this report.
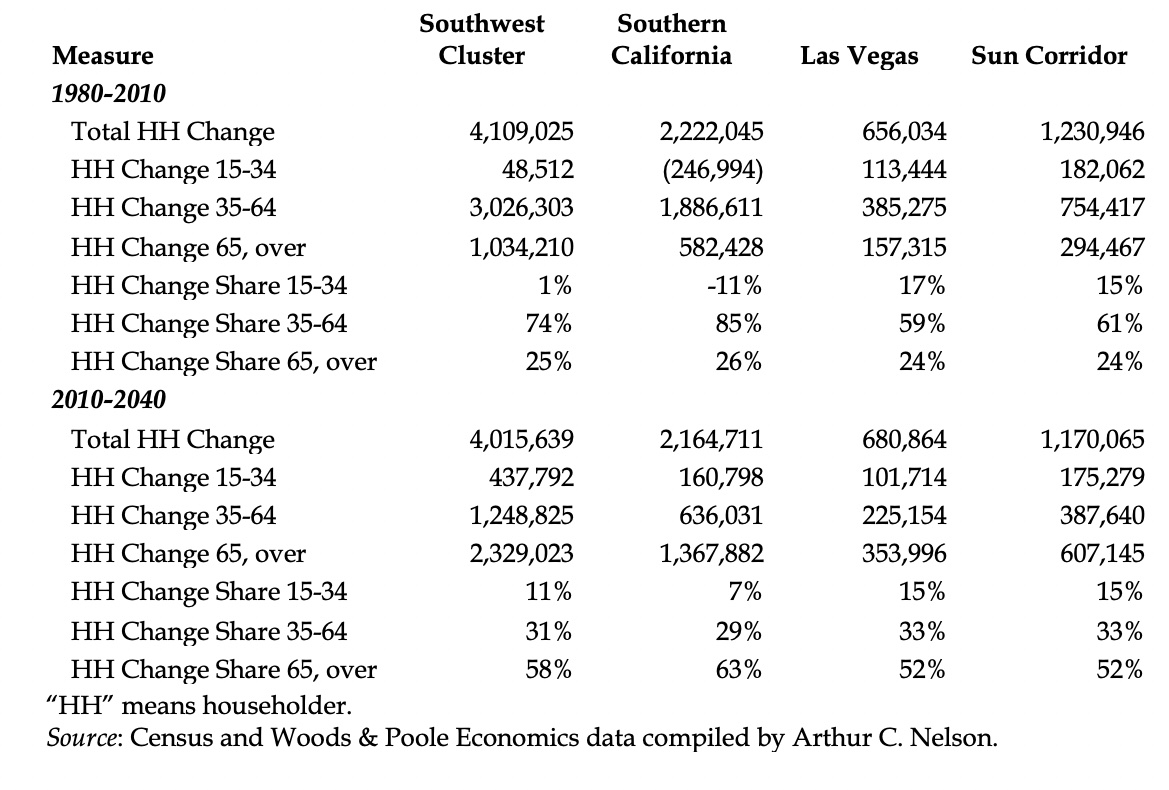
Table 13: Change and Share of Change of Householders by Age Cohort for the Southwest Megapolitan Cluster, 1980-2010 and 2010-2040.
While seemingly innocuous year-over-year, the slow drip of demographic change can have sweeping implications for housing markets within just a generation. The end of World War II combined with the GI Bill, favorable mortgage rates, and the open spaces of the suburbs transformed America’s landscape to serve the needs of Baby Boomers growing up. Once they did grow up, Boomers raised their families in the landscape they knew best: the suburbs. As Boomers are entering the last stage of their cycle, they will continue to have a profound effect on housing markets.
In perspective, for more than 60 years from the late 1940s to the early 2010s, serving the needs of Boomers as children and then their own children meant America needed to build larger homes on single family lots mostly in the suburbs. Between 1980 and 2010, the demand was so strong, for instance, that, nationally, starter home householders declined in number while peak housing demand absorbed 75 percent of the demand, and 78 percent of the demand in megapolitan areas compared to 70 percent for the rest of the nation. But the boomer-driven housing demand balloon is leaking and soon it will be gone.
Between 2010 and 2040, the housing needs of downsizing householders will dominate most American housing markets, account for two-thirds of the change in share of demand. Indeed, the share of demand for peak housing householders is projected to plummet from 75 percent nationally in the baseline period to just 23 percent.
Consider another perspective. The National Association of Realtors periodically conducts its “Community Preference Survey. The latest one available for this report was released in 2023. One question asks:
“Continue to imagine that you are moving to another home … (What) kind of community where you would like to live. Please select the community that you prefer.”
Consistent with stated preference surveys, there are only two choices:
OR
Figure 21 reports results for all surveys conducted from 2015 to 2023. It includes surveys just before the COVID-19 pandemic, February 2020, and in its first summer, July 2020. Overall, the preference for living in a walkable community even if that means living in an attached home has increased steadily from 45 percent in 2015 to 53 percent in 2023. In perspective, the number of American households who want the attached/ walkable option increased by 13 million even though the total number of households increased by just six million. The increasing demand for walkable communities, including the demand for attached options, is based mostly on demographic changes, which are predictable.

Figure 21: Preference for Living in an Attached Home in a Walkable Community Compared to Living in a Detached Home Where Driving Everywhere is Required, 2015-2023. Source: National Association of Realtors (2023).
America is simply not prepared to manage the predictable demographic-driven large-lot home housing collapse. Studies of housing shortages abound with analyses ranging from high interest rates to tangled supply chains to backward looking zoning as barriers to meet America’s emerging housing needs, especially among megapolitan areas. What they need are forward-looking strategies that alter financial and regulatory institutions to meet the needs of a fundamentally changed housing market, and the sooner the better.
Baigent, Elizabeth. 2004. Patrick Geddes, Lewis Mumford and Jean Gottmann: Divisions Over Megalopolis. Progress in Human Geography 28 (6): 687–700.
Carbonell, Armando and Robert D. Yaro. 2005. American Spatial Development and the New Megalopolis. Cambridge MA: Lincoln Institute of Land Policy.
Faludi, Andreas. 2002. European Spatial Planning. Cambridge MA: Lincoln Institute of Land Policy
Fishman, Robert. 1990. Megalopolis Unbound, Wilson Quarterly, Winter, 44–55.
Florida, Richard. 2023. The Pandemic Didn’t Upend US Geography. Bloomberg Citylab, available from https://www.bloomberg.com/news/features/2023-04-14/three-years-into-the-pandemic-the-urban-exodus-was-overblown.
Glocker, Daniela. 2018. The Rise of Megaregions: Delineating a New Scale of Economic Geography. Paris: Organization for Economic Cooperation and Development (OECD).
Hu, Richard. 2024. Megaregional China. London: Routledge. https://doi.org/10.4324/9781003108405
McCue, Daniel and Christopher Herbert. 2016. Updated Household Projections, 2015-2035: Methodology and Results, Joint Center for Housing Studies, Harvard University, Cambridge.
McKenzie, R. D. 1933. The Metropolitan Community. New York: McGraw-Hill.
Mukhopadhyay, Chandrima. 2016. Megaregions: Globalization’s New Urban Form? London: Taylor & Francis.
National Association of Realtors, 2023. Community Preference Survey. Washington DC. Available at https:// www.nar.realtor/sites/default/files/documents/2023-community-and-transp….
Nelson, Arthur C. and Robert E. Lang. 2011. Megapolitan America, New York: Routledge.
O’Sullivan, Arthur. 2019. Urban Economics. New York: McGraw-Hill.
Regional Plan Association. 2006. America 2050: A prospectus. New York: Regional Plan Association. Available at http://www.america2050.org/pdf/America2050prospectus.pdf.
Ross, Catherine, ed. 2009. Megaregions: Planning for Global Competitiveness. Washington DC: Island Press.
Ross, C., Rao, A., & Yoo, C. 2023. Megaregions and COVID-19: a call for an innovative governing structure in the United States. Regional Studies, 58(1): 1–15. https://doi.org/10.1080/00343404.2023.2183946
Samuelson, Paul. 2009. A Rail Boondoggle, Moving at High Speed. Washington Post, August 24, A18.
US Department of Transportation. 2017. Beyond Traffic 2025: Megaregion Forums, pp. 206-229, in Beyond Traffic 2045. Washington DC: United States Department of Transportation.
Yang, Jiawen, Ge Song, and Jian Lin. 2012. Measuring Spatial Structure of China’s Mega-Regions. Cambridge MA: Lincoln Institute of Land Policy. Available at https://www.lincolninst.edu/app/uploads/2024/04/yang-wp13jy1. pdf.
Yaro, Robert D., Ming Zhang, and Frederick R. Steiner. 2022. Megaregions and America’s Future. Cambridge MA: Lincoln Institute of Land Policy.
Providing expert commentary on urban topics and highlighting Penn IUR's research in the context of pressing urban issues.


